
Figure 2. Restoration of miR-200c to TNBC decreases TDO2 by direct targeting of TDO2 at a binding site in the 3’UTR, resulting in reduction of intracellular and secreted kynurenine.
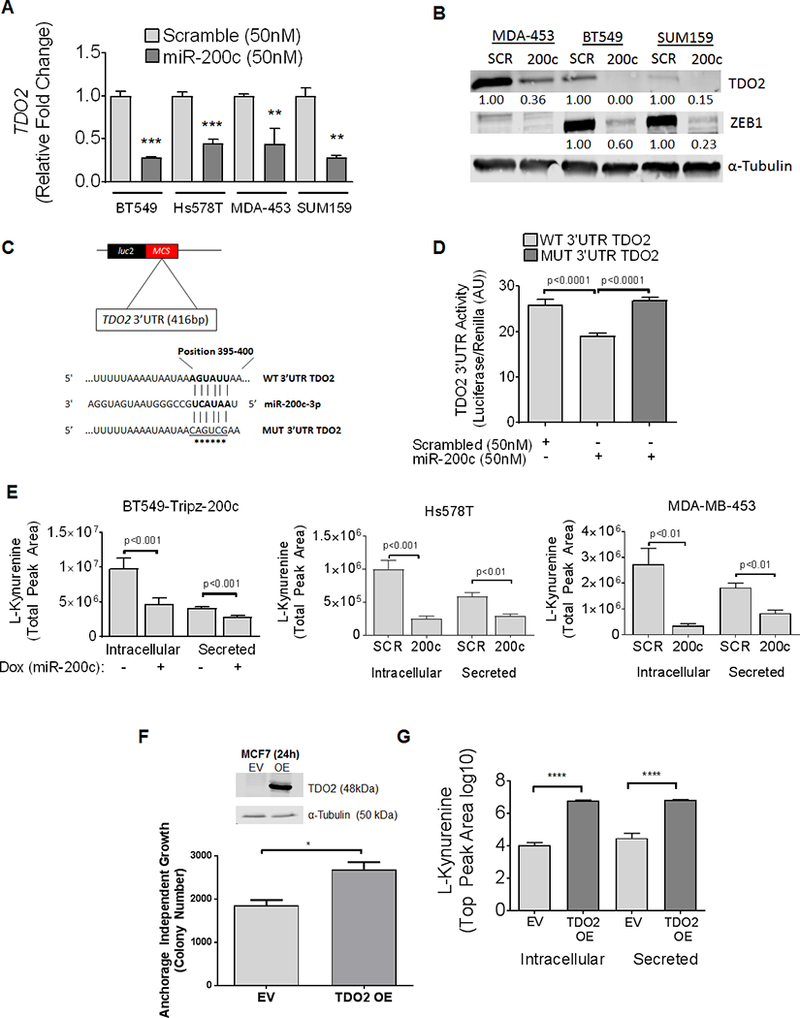
(A) Relative TDO2 mRNA levels determined by qRT-PCR in multiple TNBC cell lines following transfection with either negative SCR control mimic or miR-200c mimic for 48 hours. ***P<0.001, **P<0.01, unpaired t-test. (B) TDO2 and ZEB1 in multiple TNBC lines following transfection with negative control or miR-200c mimic for 72 hours. (C) Schematic of TDO2 3’UTR depicting predicted binding site of miR-200c at position 395–400 cloned into pmiR-Glo-luciferase vector with site-directed mutations indicated by asterisks. (D) Luciferase activity of the WT TDO2 3’UTR or mutated TDO2 3’UTR containing pmiR-Glo following transfection of BT549 cells with either negative control mimic or miR-200c mimic for 48 hours. ****P<0.0001, one-way ANOVA analysis. (E) Relative Kyn levels in BT549 cells as determined by UPLC-MS expressing a stable DOX-inducible lentiviral empty vector pTripZ vector or miR-200c-pTripZ vector after 72 hours of DOX induction (left). Relative Kyn levels measured in Hs578T and MDA-453 following transfection with SCR control or miR-200c mimic 72 hours prior (middle, right). (F) MCF7 cells transfected with expression vector for TDO2 (OE) or empty vector (EV) and immunoblot probed with TDO2 detecting antibody 24 hours after transfection (top). MCF7 cells with TDO2 OE or EV control were grown in soft-agar and colony number determined after 11 days (bottom). (G) Intracellular and secreted Kyn measured by UPLC-MS in MCF7-EV or MCF7-TDO2-OE cells after 72 hours. Data is shown on a log10 scale.