Fig. 4.
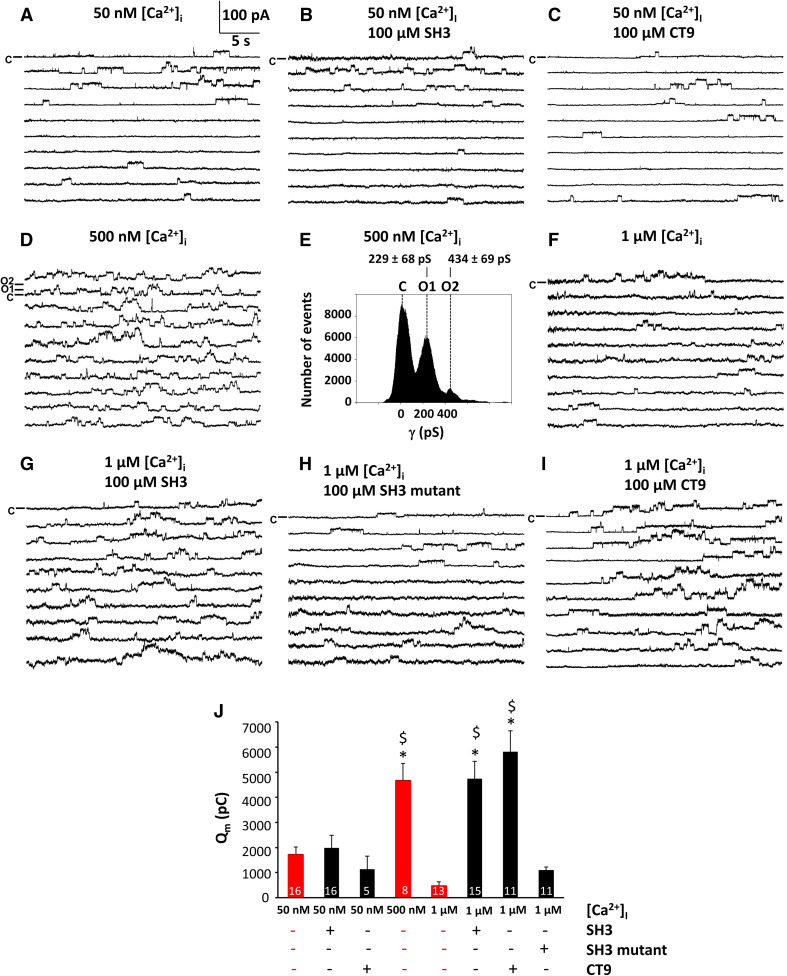
SH3 and CT9 peptide overcome the inhibition of the activity of single Cx43-hemichannels. Panels a–i (except panel e) display example traces of unitary currents obtained by 30 s voltage steps from − 30 to + 60 mV in Cx43-overexpressing HeLa cells, whereby the closed state is indicated on the first trace with the symbol C. In panel d, open state 1 (O1) indicates a single channel opening event and open state 2 (O2) the opening of another channel superimposed on the first one. The [Ca2+]i conditions indicated were applied via the whole-cell recording pipette. Peptides were added at 100 µM final concentrations. a–c Example traces showing unitary currents obtained at 50 nM [Ca2+]i, which corresponds to resting [Ca2+]i conditions, in the absence (a) or presence of peptides, namely SH3-binding domain (b) and CT9 region (c). d Example traces showing unitary currents obtained at 500 nM [Ca2+]i, which corresponds to the range of [Ca2+]i rises occurring upon physiological signaling. e All-point histogram obtained from the recordings depicted in d, indicating a single channel conductance in the ~ 220 pS range. f–i Example traces showing unitary currents obtained at 1 µM [Ca2+]i, which corresponds to a [Ca2+]i that is able to activate the actomyosin cytoskeleton, in the absence (f) or presence of peptides, namely SH3-binding domain (g), a mutant of the SH3-binding domain (h) and the CT9 region (i). j Summary data obtained by integrating the current traces over time, giving the membrane charge transfer (Q m), for the different conditions applied. The bar graph illustrates that SH3 and CT9 peptides remove hemichannel inhibition at 1 µM [Ca2+]i while mutant SH3 is inactive. Bars corresponding to control conditions without peptide additions are shown in red. Asterisk and dollar sign indicate significant difference compared to the condition with [Ca2+]i being 50 nM and 1 µM, respectively

