
Figure 2 |. R-loop accumulation in Ewing sarcoma.
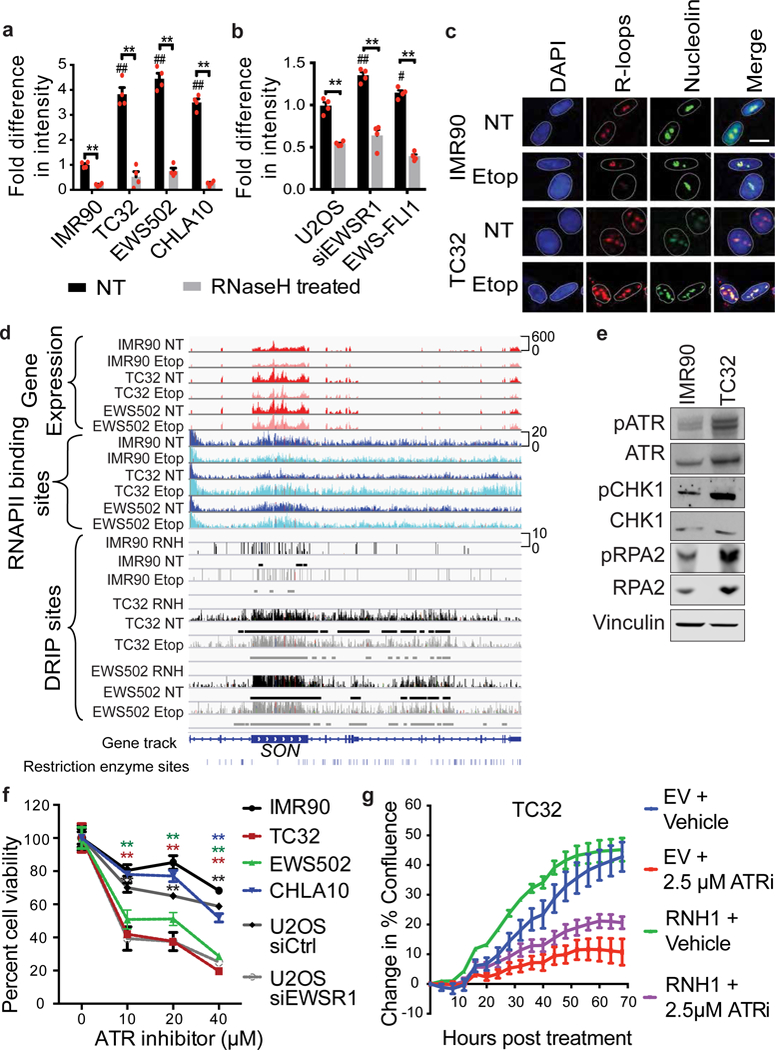
a, b, Fold-difference in genomic R-loops in IMR90 versus Ewing sarcoma cells (a) and U2OS cells with indicated transfections (b); n = 4 technical replicates. c, Representative immunofluorescence images of nuclei (DAPI), R-loops (S9.6) and nucleoli (nucleolin). Scale bar, 25 μm. d, Thirty-five-kilobase region surrounding the SON gene containing RNA-seq (red), RNAPII ChIP–seq (blue), DRIP–seq (black) and RNaseH-treated (RNH) tracks. Etop, etoposide-treated. Track height represents read counts. e, Immunoblots of indicated replication stress proteins. f, Cell viability response to ATR inhibitor; n = 4 technical replicates. g, Proliferation rate of TC32 cells overexpressing RNaseH1 (RNH1) after ATR inhibition (ATRi). EV, empty vector; n = 3 transfection replicates. Mean ± s.e.m., one-way ANOVA compared to IMR90 control, two-tailed t-test within each cell line. #,*P < 0.05; ##,**P < 0.005, # shows significance compared to control (NT).