
Extended Data Figure 4 |. DRIP–seq data validation.
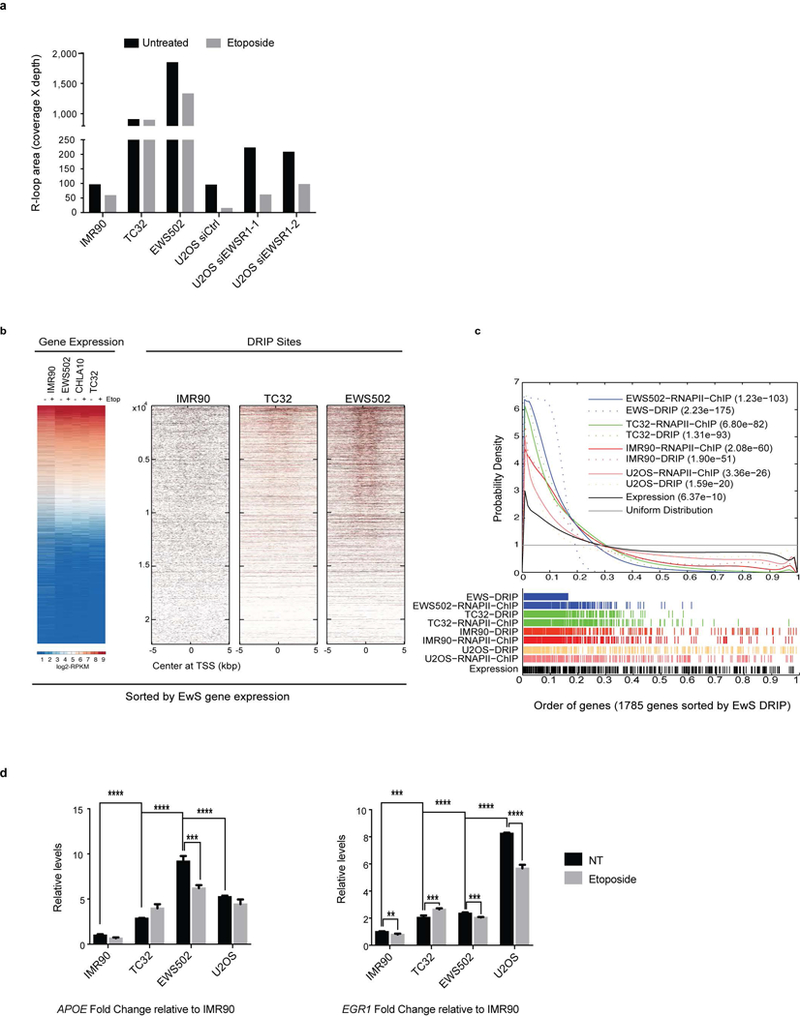
a, Quantification of DRIP (coverage of DRIP region multiplied by reads in that region) across all samples. y-axis is graphed in logarithmic scale. b, Representative whole-genome heatmaps centred around TSS ordered by average expression of Ewing sarcoma cells. c, Probability density graph plotted with a Gaussian smoothing kernel of the distribution of DRIP peaks and EWS–FLI1 ChIP peaks at EWS–FLI1 bound genes relative to uniform distribution. n = 281 genes (top 16%). Inset, P values depicting significance of enrichment for each sample. d, Fold enrichment of qPCR product from ChIP experiments done with RNAPII antibody in control and Ewing sarcoma cell lines. The primers target well-known R-loop regions within APOE and EGR1 genes. Mean ± s.e.m., n = 3 technical replicates, ***P < 0.0005, ****P < 0.00005. One-way ANOVA across cell lines compared to IMR90 cells and two-tailed t-test within cell lines.