Fig. 2.

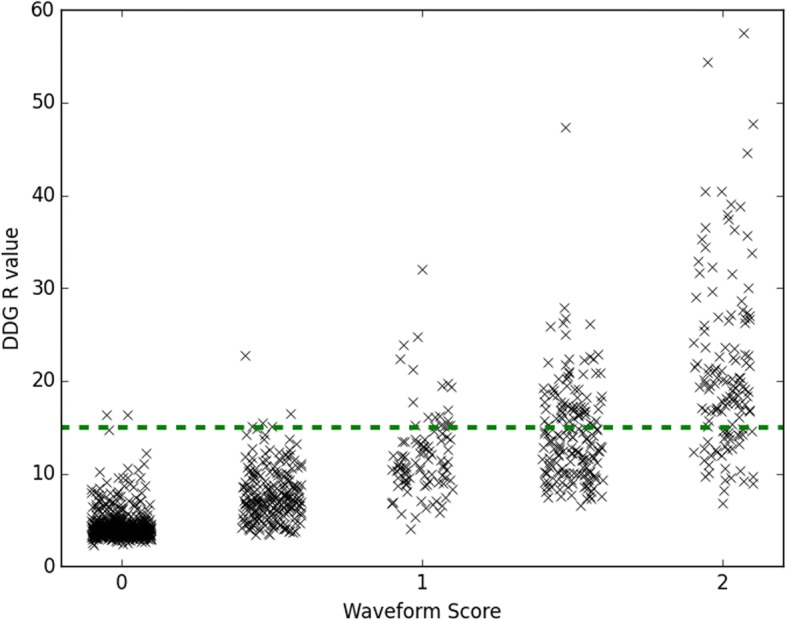
Relationship between the algorithm’s figure of merit for the waveform (the R value) and the waveform score S as determined by two readers from visual inspection of the waveform. The horizontal dashed line shows a threshold, R = 15

Relationship between the algorithm’s figure of merit for the waveform (the R value) and the waveform score S as determined by two readers from visual inspection of the waveform. The horizontal dashed line shows a threshold, R = 15