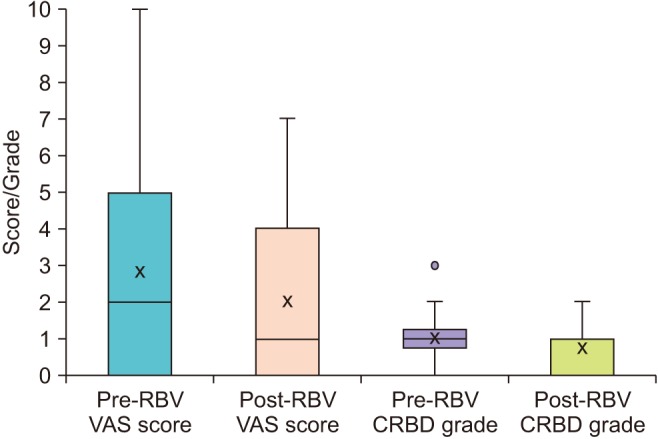
Fig. 1. Box and whisker plots displaying variation in scores and grades between VAS and CRBD groups respectively, before and after deflating the balloon. VAS, visual analogic scale; CRBD, catheter-related bladder discomfort; RBV, reduction of balloon volume.

