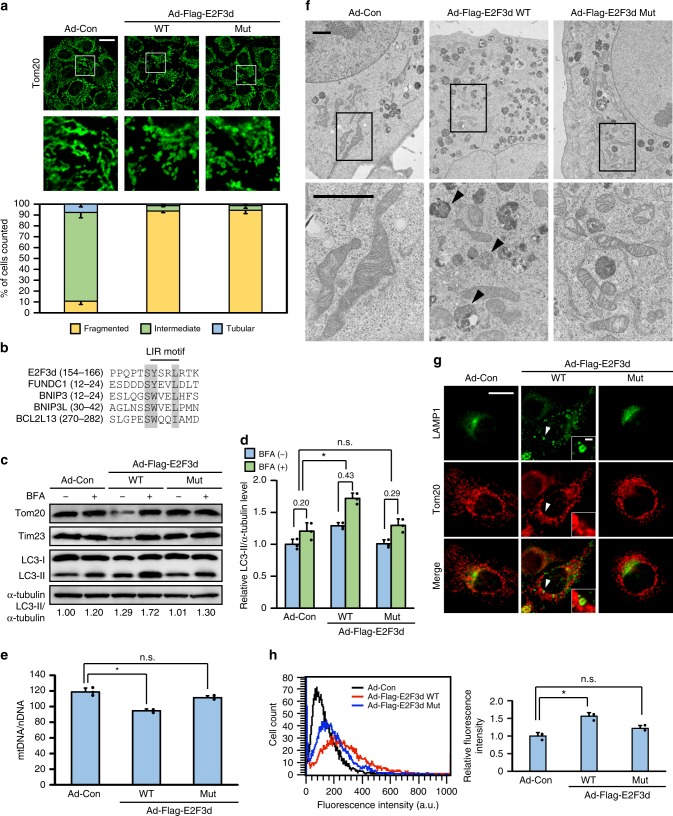
Fig. 3.
E2F3d induces mitochondrial fragmentation and mitophagy. HeLa cells were infected with control adenovirus (Ad-Con) or adenoviruses expressing Flag-tagged WT or LIR mutant E2F3d (Ad-Flag-E2F3d WT or Mut). a Cells were immunostained with anti-Tom20 antibody. The bottom images show magnifications of the boxed areas in the top images. Scale bar, 20 μm. The graph shows the percentage of cells exhibiting fragmented, intermediate, or tubular mitochondrial morphologies. Data are presented as the mean of three independent experiments (≥100 cells). Error bars represent SD. b Sequence alignment of the putative LIR motif in E2F3d and other known mitophagy receptors. The shaded regions indicate highly conserved residues. c Cells were treated with BFA (100 nM) for 16 h and cell lysates were examined by immunoblotting. LC3-II protein levels were normalized to α-tubulin to determine the differences in levels between the absence and presence of BFA. d Statistical analysis of quantified LC3-II protein levels in c. Data are presented as the mean of three independent experiments. Error bars represent SD. *P < 0.05. n.s. not significant. e Mitochondrial DNA (mtDNA) content was normalized to nuclear DNA (nDNA). Data are presented as the mean of three independent experiments. Error bars represent SD. *P < 0.05. n.s. not significant. f Cells were analyzed by electron microscopy. The boxed areas are shown at higher magnification. Arrowheads represent mitochondrion-like structures surrounded by a limiting membrane. Scale bars, 2 μm. g Cells were immunostained with anti-LAMP1 and anti-Tom20 antibodies. Scale bar, 20 μm. The areas pointed by arrowheads are shown at higher magnification. Scale bar, 2 μm. h The uptake of mitochondria by lysosomes was evaluated by mitophagy assay. Data are presented as the mean of three independent experiments (≥10,000 cells). Error bars represent SD. *P < 0.05. n.s. not significant, a.u. arbitrary units. Full-size scans of immunoblots are shown in Supplementary Information. Please see Supplementary Figs. 2–4

