Fig. 5.
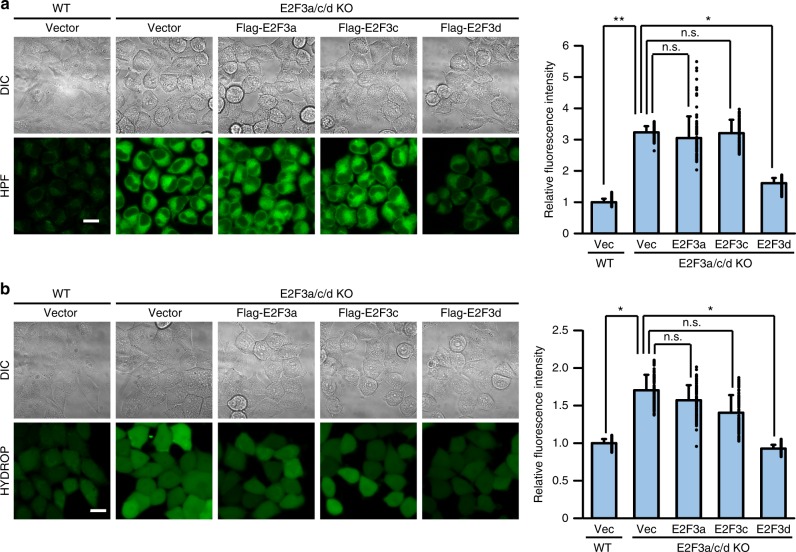
E2F3d affects intracellular ROS levels. a, b E2F3a/c/d KO HeLa cells were infected with control retrovirus (Vec) or retroviruses expressing Flag-E2F3a, Flag-E2F3c, or Flag-E2F3d. Intracellular ROS levels were analyzed using the fluorescent probes hydroxyl radical and peroxynitrite sensor HPF (a) and hydrogen peroxide sensor HYDROP (b). Differential interference contrast (DIC) and fluorescent images of HPF or HYDROP are shown. Scale bar, 20 μm. The mean fluorescence intensity was quantified (n = 200). Relative fluorescence intensities to parental WT cells infected with control retrovirus (Vec) are shown. Error bars represent SD. *P < 0.05 and **P < 0.01. n.s. not significant

