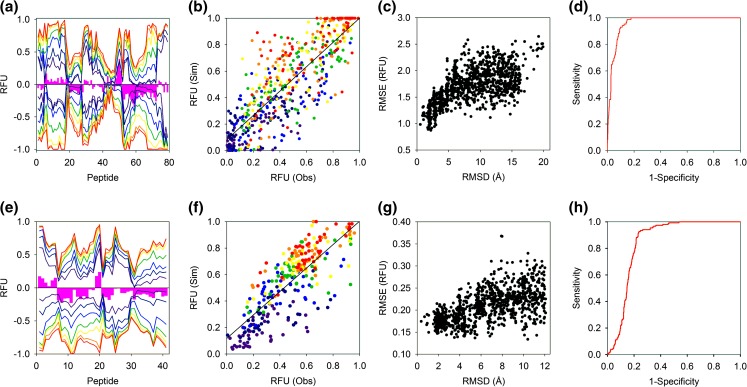
Figure 2.
Native folds of alpha lactalbumin and barnase investigated by HDX-MS: (a, e) Mirror plots comparing experimental (positive) and simulated (negative) HDX-MS outputs. Experimental data were acquired at 0.25, 1, 5, 20, 60, 240 and 480 min at 293.15 K (coloured dark blue through red respectively). The pink bars denote the time-averaged difference in RFU between the experimental and simulated data and are shown to highlight areas of significant change. (b, f) Scatterplot comparing observed and simulated HDX-MS data of all RFU time points with different labelling times coloured as in (a). (c, g) The relationship between the RMSE and RMSD of 1000 decoys. The RMSE was calculated by pairwise comparison of the simulated and experimental HDX-MS data and the RMSD determined by alignment with the crystal structure. (d–h) ROC plots demonstrating the ability of the HDX-MS simulations to classify protein structures. Decoys with an RMSD ≤ 2.5 Å with the crystal structure were classified as native. Alpha lactalbumin and barnase data are shown in the upper and lower four figures, respectively

