Figure 4.
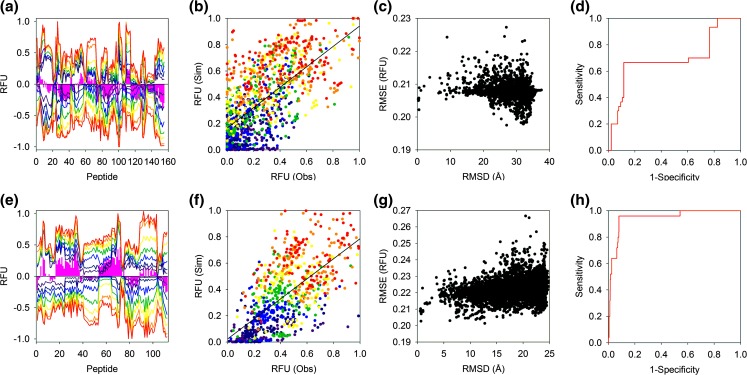
Native structures of enolase and SAP investigated by HDX-MS: (a, e) Mirror plots comparing experimental (positive) and simulated (negative) HDX-MS outputs. Experimental data were acquired at 0.25, 1, 5, 20, 60, 240, and 480 min at 293.15 K (coloured dark blue through red respectively). The pink bars denote the time-averaged difference in RFU between the experimental and simulated data and are shown to highlight areas of significant change. (b, f) Scatterplot comparing observed and simulated HDX-MS data of all RFU time points with different labelling times coloured as in (a). (c, g) The relationship between the RMSE and RMSD for a range of decoys. The RMSE was calculated by pairwise comparison of the simulated and experimental HDX-MS data and the RMSD determined by alignment with the crystal structure. (d–h) ROC plots demonstrating the ability of the HDX-MS simulations to classify protein structures. Decoys with an RMSD ≤ 2.5 Å with the crystal structure were classified as native. Enolase and SAP data are shown in the upper and lower four figures, respectively

