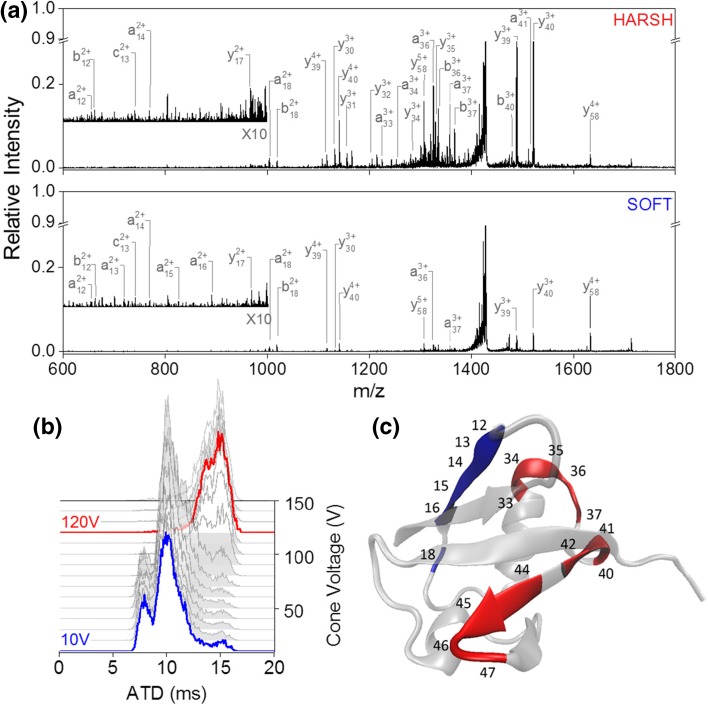
Figure 2.
UVPD of two different conformational arrangements of [M + 6H]6+ ubiquitin. (a) UVPD spectra obtained at cone voltage 10 V (blue, bottom spectrum) and cone voltage 120 V (red, top spectrum). (b) Arrival time distribution as a function of cone voltage ranging from 10 to 120 V. (c) UVPD cleavage sites indicated on the crystal structure (PDB structure 4Z9S [65]) of ubiquitin. Sites with higher relative cleavage abundance in the ‘soft’ spectra are coloured blue; those with higher abundance in ‘harsh’ condition are marked red

