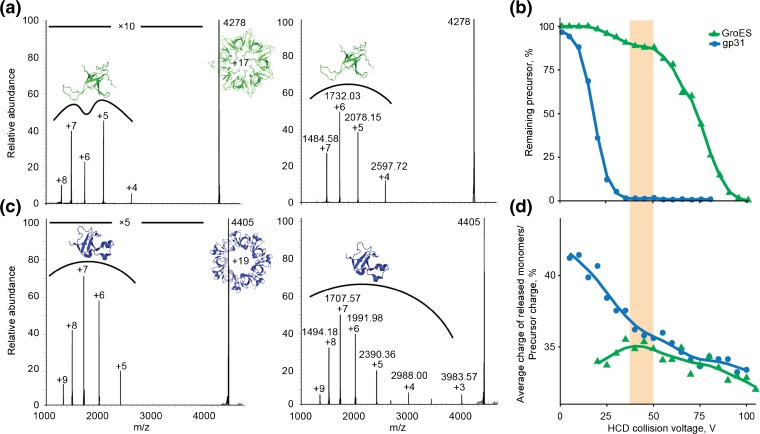
Figure 2.
Tandem mass spectra and breakdown curves of mass-selected GroES and gp31 heptamers. Tandem MS of (a) GroES17+, HCD voltage 40 V (left) and HCD voltage 75 V (right), and (c) gp3119+, HCD voltage 20 V (left) and HCD voltage 25 V (right); × 5 and × 10 are magnification factors for indicated region. (b) Breakdown curves of GroES17+ and gp3119+ against range of applied collision voltages. (d) Average charge of monomers released from GroES17+ and gp3119+ as percentage of precursor charge plotted against the applied HCD voltages

