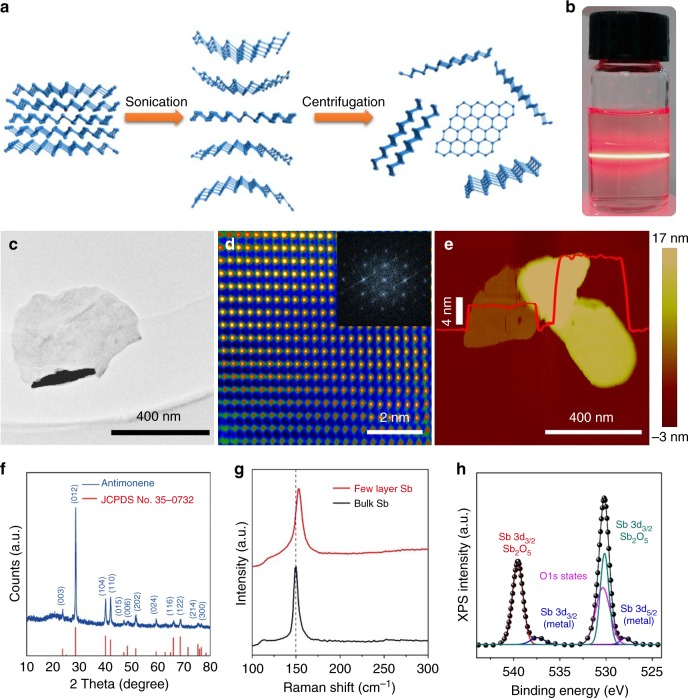
Fig. 3.
Fabrication and characterization of antimonene materials. a A schematic representation of the preparation process of two-dimensional antimonene. b Photograph of a dispersion of exfoliated antimonene showing the Faraday–Tyndall effect. c, d TEM (scale bar = 400 nm) and FFT-masked HRTEM images (scale bar = 2 nm) of few-layer antimonene after exfoliation. e AFM topography showing few-layer antimonene on mica (scale bar = 400 nm). f XRD spectrum of antimonene (blue line). g Raman spectra of bulk antimony with β-phase (black line) and few-layer antimonene (blue line). The two peaks represent two different vibrational modes. h XPS spectra of Sb 3d

