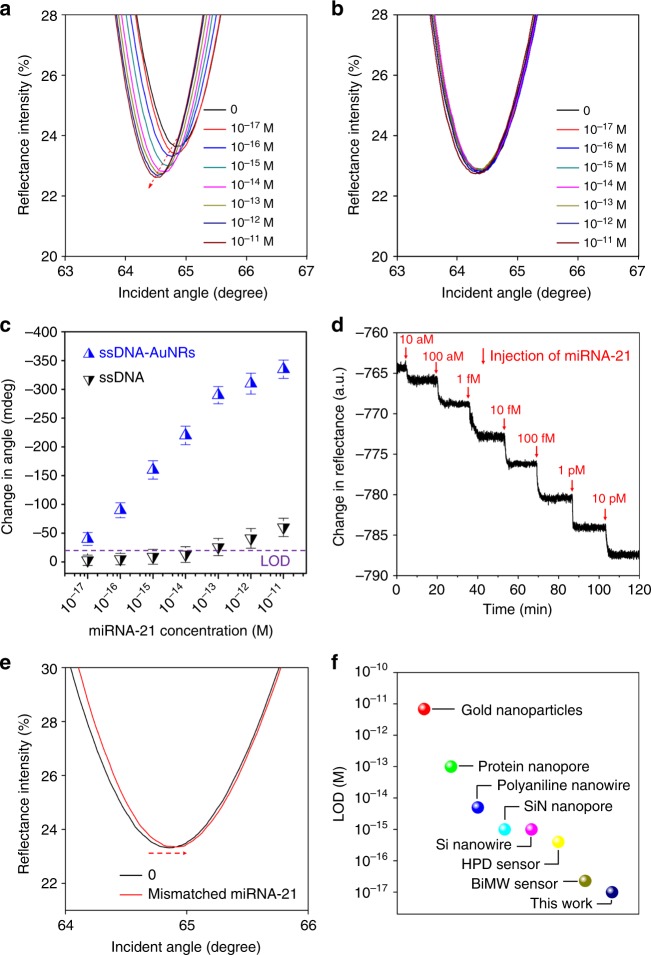
Fig. 5.
Sensing miRNA-21 using an antimonene SPR sensor. a SPR spectra with miRNA-21 concentrations ranging from 10−17 to 10−11 M using AuNRs amplification. The arrow denotes the shift in the SPR angle. b SPR spectra with miRNA-21 concentrations ranging from 10−17 to 10−11 M without AuNRs. c The relationship between the SPR angle and miRNA concentration. Each point corresponds to the SPR angle shift with the indicated miRNA concentration. All error bars is the standard error of SPR angle shift from five data points. d The real-time SPR response of ssDNA-AuNR desorption from the antimonene surface. e The SPR curve change of miRNA-21 contained one mismatched nucleobase (red line). f Comparison of the LOD of the antimonene miRNA SPR sensor with that of state-of-the-art sensors

