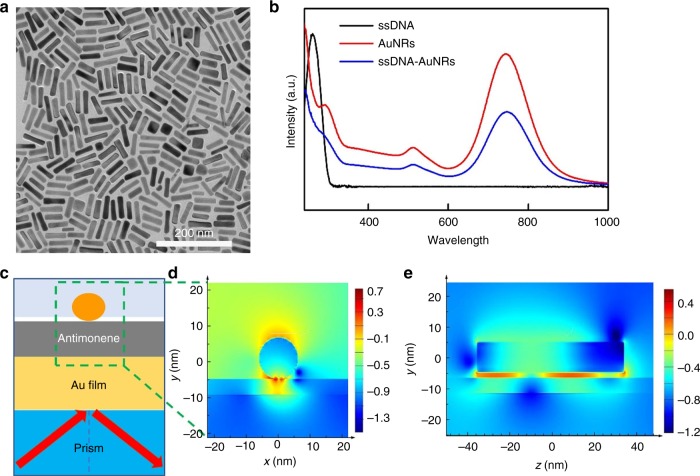
Fig. 6.
Signal amplification of AuNRs. a TEM image of gold nanorods (scale bar = 200 nm). b UV-Vis characterization spectra of ssDNA (black line), AuNRs (red line), and AuNR-ssDNA (blue line). c Schematic diagram of the SPR-AuNR configuration used for the FDTD simulation. d The FDTD calculated enhancement in the local electric field distribution (log |E Einc−1|2) of AuNRs at 632.8 nm with the incident wave-plane polarized along the x-direction. A 5 nm antimonene is set between the gold film and AuNRs. e The side view of FDTD calculated enhancement in the local electric field distribution

