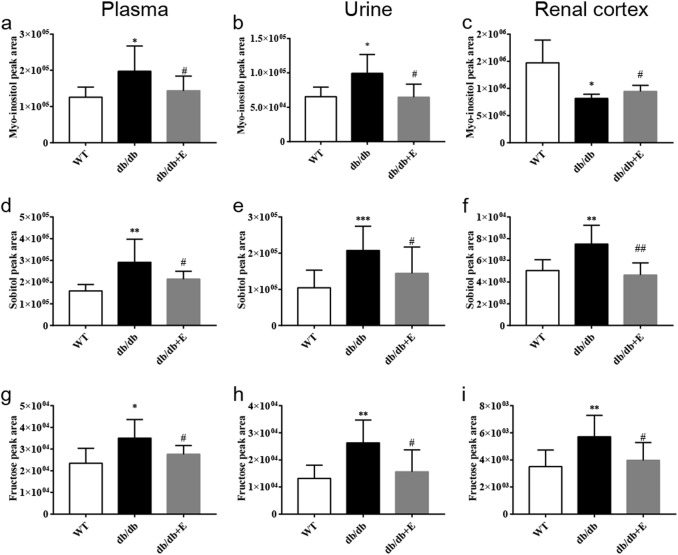
Fig. 7.
Relative abundance of myo-inositol, sorbitol, and fructose in the plasma, urine, and renal cortex of the mice. Myo-inositol (a–c), sorbitol (d–f), and fructose (g–i) levels change in plasma, urine, and renal cortex extracts measured directly by GC/MS peak areas. The data are expressed as the mean ± SD. *P < 0.05, **P < 0.01, ***P < 0.001 vs. WT group; #P < 0.05, ##P < 0.01 vs. db/db group

