Fig. 6.
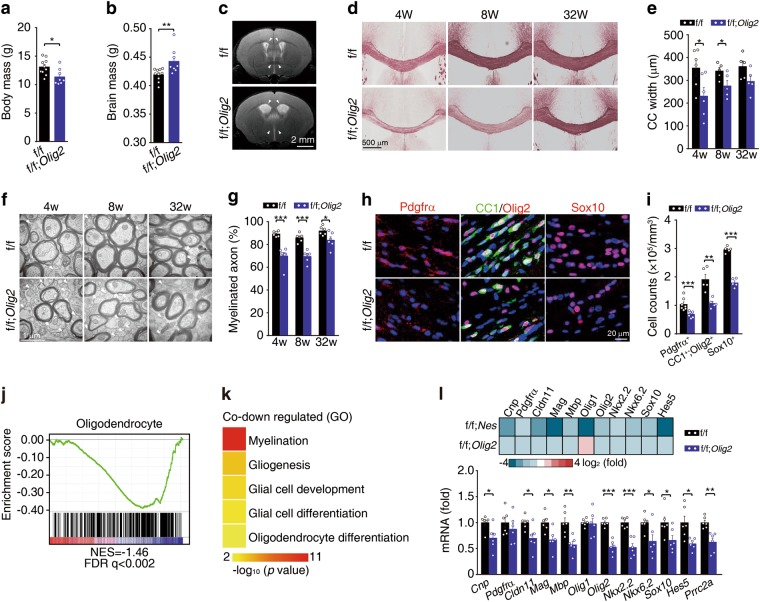
Prrc2a deletion in oligodendroglial lineage induces hypomyelination. a, b Body and whole wet brain mass of Prrc2af/f;Olig2Cre+/- and control mice at P28 (two-tailed unpaired Student’s t-test, *P < 0.05, **P < 0.01, f/f, n = 10, f/f; Olig2 n = 8). c T2-weighted MRI examination of 4-week-old mice with indicated genotypes. d Black-gold staining of brain slices from 4-, 8-, and 32-week-old Prrc2af/f; Olig2Cre+/- and control mice. e The quantification of corpus callosum width at the midline of 4-, 8-, and 32-week-old Prrc2af/f; Olig2Cre+/- and control mice (two-tailed unpaired Student’s t-test, *P < 0.05, 4w: n = 6 each group, 8w: n = 5 each group, 32w: n = 5 each group). f TEM analysis of the myelin fibers in the corpus callosum from 4-, 8-, and 32-week-old Prrc2af/f; Olig2Cre+/- and control mice. The white arrowheads indicated the naked axons. g The percentage of myelinated axons in the corpus callosum from 4-, 8-, and 32-week-old mice with indicated genotypes (two-tailed unpaired Student’s t-test, *P < 0.05, ***P < 0.001, 4w: f/f, n = 6, f/f; Olig2-Cre n = 7, 8w: n = 6 each group, 32w: n = 6 each group). h Immunostainings of Pdgfrα (P7), CC1/Olig2, or Sox10 (P28) in corpus callosum from mice with indicated genotypes. The quantification of Pdgfrα+, CC1+ Olig2+, or Sox10+ cells was shown in (i) (two-tailed unpaired Student’s t-test, **P < 0.01, ***P < 0.001, Pdgfrα + cells: n = 7 per group; CC1+ Olig2+ cells: n = 5 per group, Sox10+ cells: n = 5 per group). j GSEA plots evaluating the changes in oligodendroglia linage specific genes in brain tissue samples from 4-week-old Prrc2af/f; Olig2Cre+/- vs. control mice. Note that FDR < 0.25 is statistically significant for GSEA analysis. k Representative GO terms of the biological process categories enriched in transcripts with downregulated expressions from Prrc2af/f; NestinCre+/- and Prrc2af/f; Olig2Cre+/- mice. l Upper panel shows the heamap of representative DEGs from Prrc2af/f; NestinCre+/- and Prrc2af/f; Olig2Cre+/, respectively. Bottom panel shows relative gene expression in hippocampus from indicated groups by RT-qPCR analysis (two-tailed unpaired Student’s t-test, *P < 0.05, **P < 0.01, ***P < 0.001, n = 6 per group)

