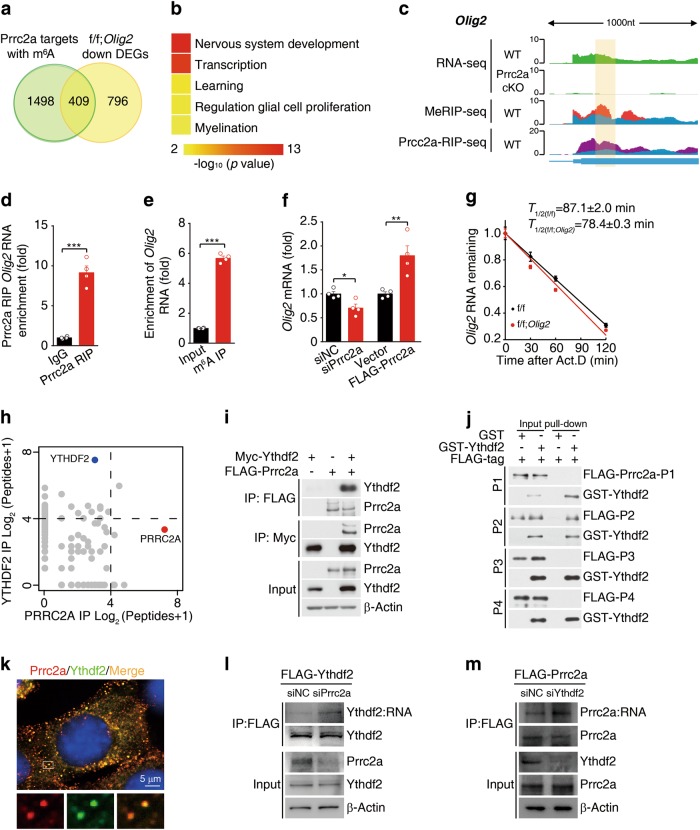
Fig. 7.
Prrc2a regulates Olig2 mRNA stability in an m6A-dependent manner. a Overlap of genes with Prrc2a binding region containing m6A peaks and genes differentially expressed in Prrc2af/f; Olig2Cre+/- vs. control samples. b Representative Gene Ontology (GO) terms of the biological process categories enriched in differentially expressed transcripts with Prrc2a binding region containing m6A peaks. c Integrative Genomics Viewer (IGV) tracks displaying RNA-seq (upper panels), MeRIP-seq (Middle panel), and Prrc2a RIP-seq (bottom panel) read distributions in Olig2 mRNA. Significant peaks are indicated with yellow highlight. d Prrc2a RIP-qPCR analysis of the region containing Prrc2a binding peak in Olig2 mRNA from brain tissues of 4-week-old mice (two-tailed unpaired student’s t-test, ***P < 0.001, n = 4 per group). e Detection of m6A enrichment in Olig2 mRNA from brain tissues of 4-week-old mice by m6A-RIP-qPCR (two-tailed unpaired student’s t-test, ***P < 0.001, n = 4 per group). f The mRNA level of Olig2 in GL261 cell with or without Prrc2a knockdown/overexpression (two-tailed unpaired student’s t-test, *P < 0.05, **P < 0.01, n = 4 per group). g Cultured OPCs from control or Prrc2af/f; Olig2Cre+/- mice were exposed to actinomycin D (1 μg/ml), then RNA was isolated at indicated time points. RT-qPCR was performed to assess the half-lives of Olig2 mRNA. The data were presented as means ± s.e.m. and the inserted numbers (T1/2 (f/f) = 87.1 ± 2.0 min; T1/2(f/f; Olig2) = 78.4 ± 0.3 min) showed the calculated half-times from four independent experiments. h Scatter plots of proteins bound to PRRC2A (red) vs. YTHDF2 (blue). (see also Supplementary information, Table S8). i Lysates from HEK293T cells transfected with indicated plasmids were subjected to immunoprecipitation with anti-FLAG or anti-Myc antibody, followed by immunoblotting with anti-Myc, anti-FLAG, or anti-β-actin antibody. j In vitro GST pull-down assay using purified GST-YTHDF2 and FLAG-Prrc2a-P1, FLAG-Prrc2a-P2, FLAG-Prrc2a-P3, or FLAG-Prrc2a-P4. k Confocal images of Prrc2a (red) and Ythdf2 (green) colocalization in HT-22 cells. l HT-22 cells stably expressing FLAG-Ythdf2 were transfected with Prrc2a siRNA or control siRNA. 72 h later, the cells were collected and subjected to PAR-CLIP analysis by immunoprecipitation with anti-FLAG antibody. The RNA products were labeled with biotin at 3′ end and then visualized by the chemiluminescent nucleic acid detection module. m HT-22 cells stably expressing FLAG-Prrc2a were transfected with Ythdf2 siRNA or control siRNA. 72 h later, the cells were collected and subjected to PAR-CLIP analysis by immunoprecipitation with anti-FLAG antibody. The RNA products were labeled with biotin at 3′ end and then visualized by the chemiluminescent nucleic acid detection module

