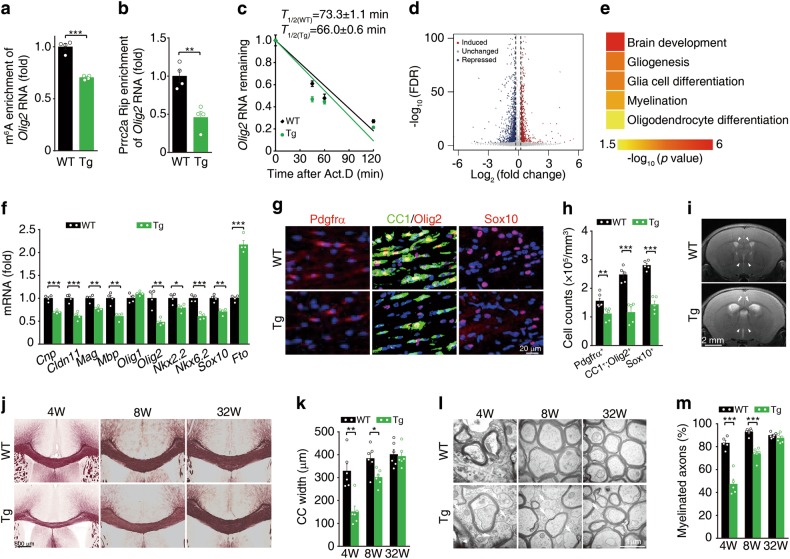
Fig. 8.
Fto transgene triggers hypomyelination. a MeRIP-qPCR analysis of Olig2 RNA in m6A peak region in Fto transgenic (Tg) and wild-type (WT) mice at 4-weeks-old (two-tailed unpaired student’s t-test, ***P < 0.001, n = 4 per group). b Prrc2a RIP-qPCR analysis of Olig2 RNA in m6A peak region in Fto transgenic (Tg) and WT mice at 4 weeks old (two-tailed unpaired student’s t-test, **P < 0.01, n = 4 per group). c Cultured OPCs from WT and Fto transgenic mice were exposed to actinomycin D (1 μg/ml), then RNA was isolated at indicated time points. RT-qPCR was performed to assess the half-lives of Olig2 mRNA. The data were presented as means ± s.e.m. and the inserted numbers (T1/2 (WT) = 73.3 ± 1.1 min; T1/2(Tg) = 66.0 ± 0.6 min) show the calculated half-times from four independent experiments. d Volcano plot of RNA-seq data showing Fto-regulated genes from brain tissue samples of 4-week-old Fto transgenic vs. control mice. e Parts of GO terms of the biological process categories enriched in DEGs from Fto transgene vs. control samples. f Relative gene expression in hippocampus from 4-week-old Fto Tg and control mice (two-tailed unpaired student’s t-test, *P < 0.05, **P < 0.01, ***P < 0.001, n = 4 per group). g Immunostainings of Pdgfrα (P7), CC1/Olig2, or Sox10 (P28) in corpus callosum from mice with indicated genotypes. The quantification of Pdgfrα+, CC1+ Olig2+, and Sox10+ cells were shown in (h) (two-tailed unpaired student’s t-test, **P < 0.01, ***P < 0.001, Pdgfrα+: n = 6 each group; CC1+ Olig2+ cells: n = 5 per group, Sox10+ cells: n = 5 per group). i T2-weighted MRI of 4-week-old mice with indicated genotypes. j Black-gold staining of brain sections from 4-, 8-, and 32-week-old Fto Tg and control mice. k The quantification of corpus callosum width at the midline from 4-, 8-, and 32-week-old Fto Tg and control mice (two-tailed unpaired student’s t-test, *P < 0.05, **P < 0.01, 4w: n = 5 per group, 8w: n = 6 per group, 32w: n = 6 per group). l TEM analysis of the myelin fibers in the corpus callosum from mice with indicated genotypes and ages. The white arrowheads indicated the naked axons. m The percentage of myelinated axons in the corpus callosum from 4-, 8-, and 32-week-old mice with indicated genotypes (two-tailed unpaired student’s t-test, ***P < 0.001, 4w: n = 5 per group, 8w: n = 6 per group, 32w: n = 6 per group)

