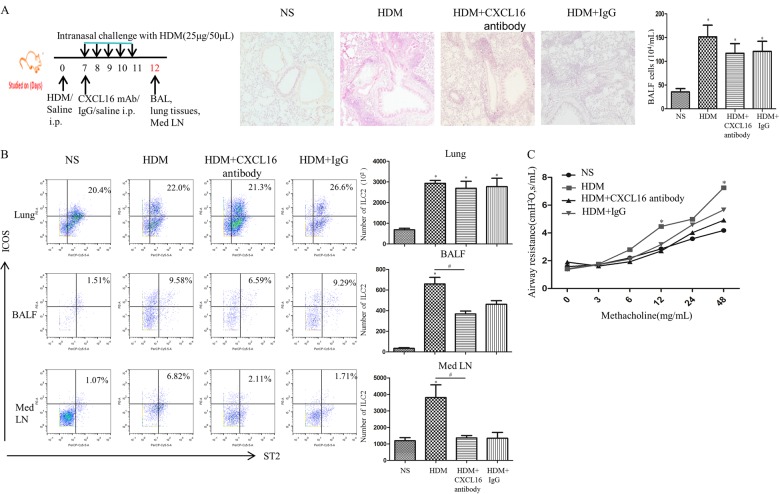
Fig. 9.
a Top left panel shows the schedule of murine challenge. Top right panel shows representative photomicrographs of hematoxylin and eosin-stained lung sections (original magnification ×20). b Left: flow cytometric identification of ILC2s in single-cell suspensions of the lung parenchyma (Lung), BAL fluid (BALF) and mediastinal lymph nodes (Med LN) of challenged animals. Right: quantification of ILC2s in the lung, BALF and Med LN in treated groups. Bars show the mean ± SEM ((n = 4 in each group. *p < 0.05 vs. NS-challenged mice, #p < 0.05 vs. HDM-challenged mice). c Airway resistance of HDM-challenged, HDM + CXCL16 antibody-challenged, HDM + IgG-challenged and saline (NS)-challenged mice. Data are presented as the mean ± SEM (n = 4 in each group. *p < 0.05 vs. NS-challenged mice, # p < 0.05 vs. HDM-challenged mice)

