Fig. 3.
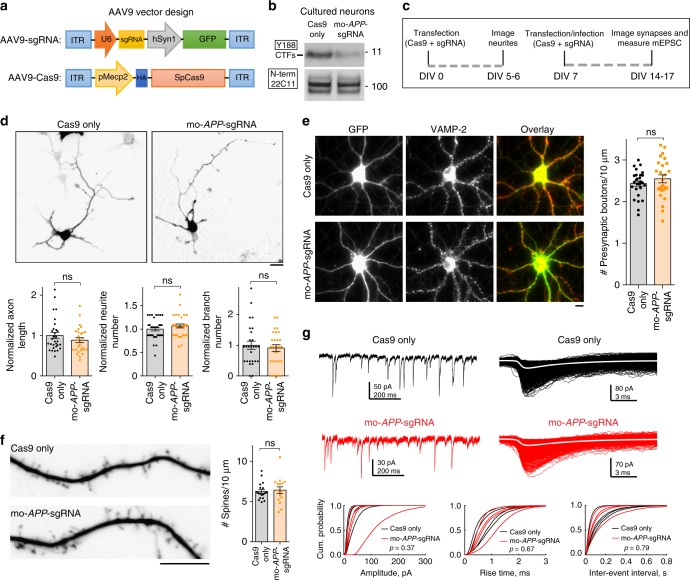
Effect of APP C-terminus editing on neuronal physiology. a AAV9-sgRNA and AAV9-Cas9 expression vectors. Note that the sgRNA vector co-expresses GFP and the Cas9 is tagged to HA, for identification of transduced neurons. b Cultured hippocampal neurons were transduced with AAV9s carrying mo-APP-sgRNA/Cas9 (or Cas9 only) and immunoblotted with the Y188 and 22C11 antibodies (with GSI). Note attenuation of CTFs by the mo-APP-sgRNA. c Neurons were transfected (at the time of plating) with APP CRISPR. Neuritic/axon outgrowth was analyzed after 5-6 days. Neurons were transfected or infected at DIV7 with APP CRISPR, and synapse structure/function was analyzed after 14–17 days. d Top: Representative images of neurons transfected with the mo-APP-sgRNA/Cas9 (or Cas9 only). Bottom: Quantifications of axon length and number of neurites/branches; note that there was no significant difference (mean ± SEM; axon length: 30 cells for control and 27 cells for mo-APP-sgRNA from two independent experiments, p = 0.2462; neurite number: 35 cells for control and 31 cells for mo-APP-sgRNA from two independent experiments, p = 0.2289; branch number: 27 cells for both conditions from two independent experiments, p = 0.6008 by two-tailed t-test; ns = non-significant). Scale bar 20 μm. e Neurons were infected with mo-APP-sgRNA/Cas9 (or Cas9 only), and fixed/stained with the presynaptic marker VAMP2. Note that the presynaptic density (VAMP2 puncta) was similar in both groups (mean ± SEM of VAMP2 staining along 27 dendrites for control and 25 dendrites for mo-APP-sgRNA from two independent experiments, p = 0.3132 by two-tailed t-test). Scale bar 10 μm. f Neurons were transfected with mo-APP-sgRNA/Cas9 (or Cas9 only as controls). Spine density in both groups was similar (mean ± SEM of 18 dendrites for control and 16 dendrites for mo-APP-sgRNA from two independent experiments, p = 0.7456 by two-tailed t-test). Scale bar 10 μm. g Miniature excitatory postsynaptic currents (mEPSC) were recorded from neurons infected with AAV9-APP-sgRNA/Cas9. Top: Representative mEPSC traces in control and mo-APP-sgRNA transduced neurons. Corresponding alignments of mEPSCs with average (white traces) are shown on right. Bottom: Cumulative histograms of mEPSC amplitude, 20–80% rise-time and inter-event interval in mo-APP-sgRNA/Cas9 and the Cas9-only infected neurons (note no significant differences). Source data are provided as a Source Data file

