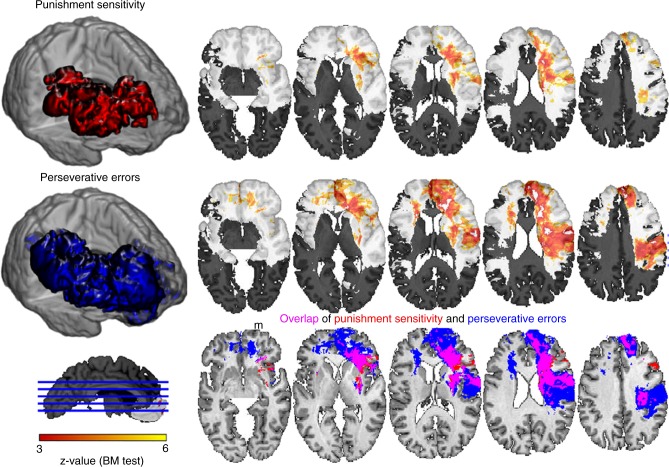
Fig. 4.
Univariate lesion mapping of WCST scores and model parameters. Punishment sensitivity (P) and perseverative errors (PSV) showed a significant lesion effect in right PFC encompassing dlPFC and frontal pole and stretching to posterior frontal and parietal cortex. Individual results for both variables are shown on transverse slices (the right hemisphere is on the right in these slices). Shaded areas indicate regions of insufficient statistical power given our 1% FDR threshold. The three-dimensional (3D) shapes of the lesion effects are shown in the colors used in the overlap slices. The overlap in the bottom panels corresponds to a conjunction analysis. Note that this is not a statistical interaction term; the three colors simply denote overlap or non-overlap, not statistical independence. Scale: z-score obtained from the Brunner–Munzel test implemented in NPM/MRIcron

