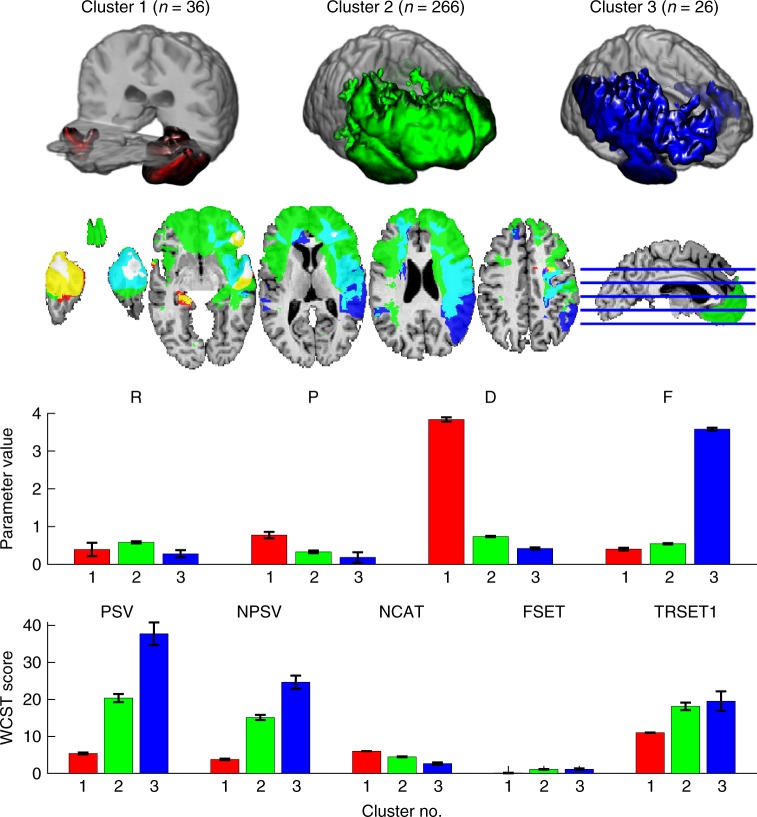
Fig. 5.
Cluster analysis of model parameters. Lesion density maps (thresholded at >8 lesions) for each cluster. The focus of each density map is in the right vlPFC with further involvement of right dlPFC and left frontal pole in clusters 2 and 3. Distinct profiles of model parameters and WCST scores corresponding to the three clusters (model parameters: mean of individual maximum a posterior (MAP) estimate ± s.e.m., WCST scores: mean ± s.e.m.)

