Fig. 3.
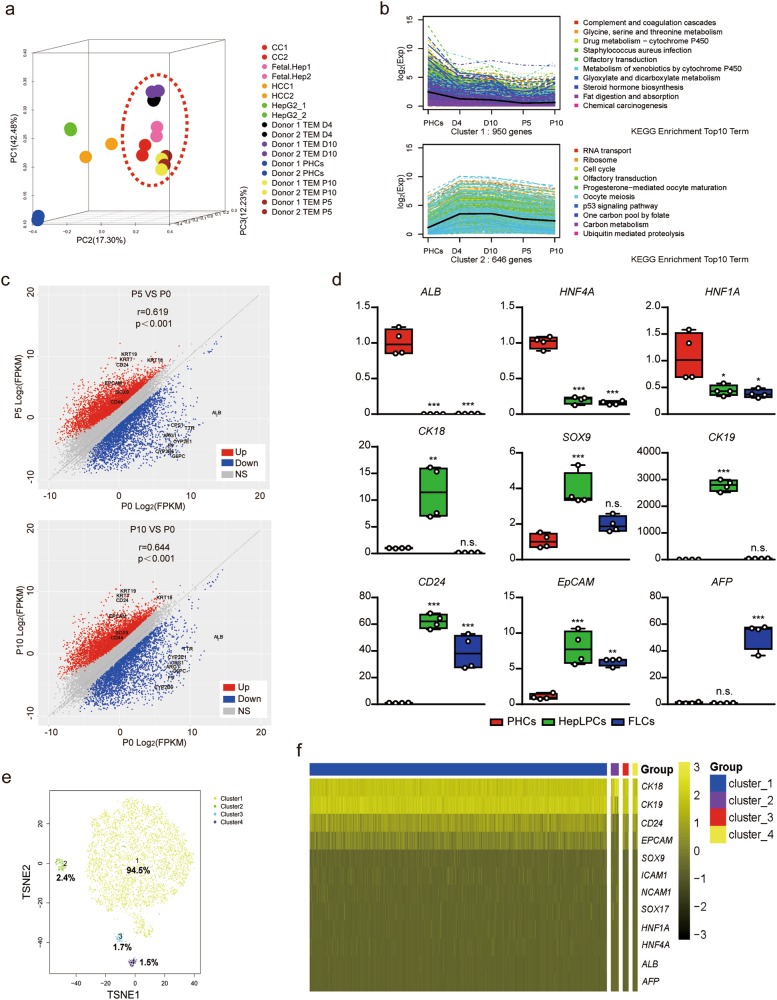
Characterization of HepLPCs. a Principal component analysis of PHCs (freshly isolated), hepatic hepatoma cell lines (HepG2), hepatocellular carcinoma (HCC), cholangiocarcinoma (CC), fetal hepatocytes (Fetal.Hep) and HepLPCs at day 4, day 10, passage 5 and passage 10 in TEM from two donors based on global gene expression profile. b K-mean analysis of hepatic function related genes (top) and cell cycle related genes (bottom) in PHCs and cells at day 4, day 10, passage 5 and passage 10 in TEM. c Correlation scatter plot show the changes of liver progenitor related genes by KEGG enriched analysis. Passage 5 or passage 10 versus PHCs (P0). d QPCR analyses for the expression of liver progenitor related genes, PHCs were freshly isolated (one-way ANOVA with Dunnett correction for multiple comparisons, n = 4 donors, n.s., non-significant, *P < 0.05, **P < 0.01, ***P < 0.001). e t-SNE projection of all 7459 individual HepLPCs based on K-means clustering, different colors represent different subgroups. f Heatmap of liver progenitor- and hepatic lineage-related genes in different subgroups

