Fig. 4.
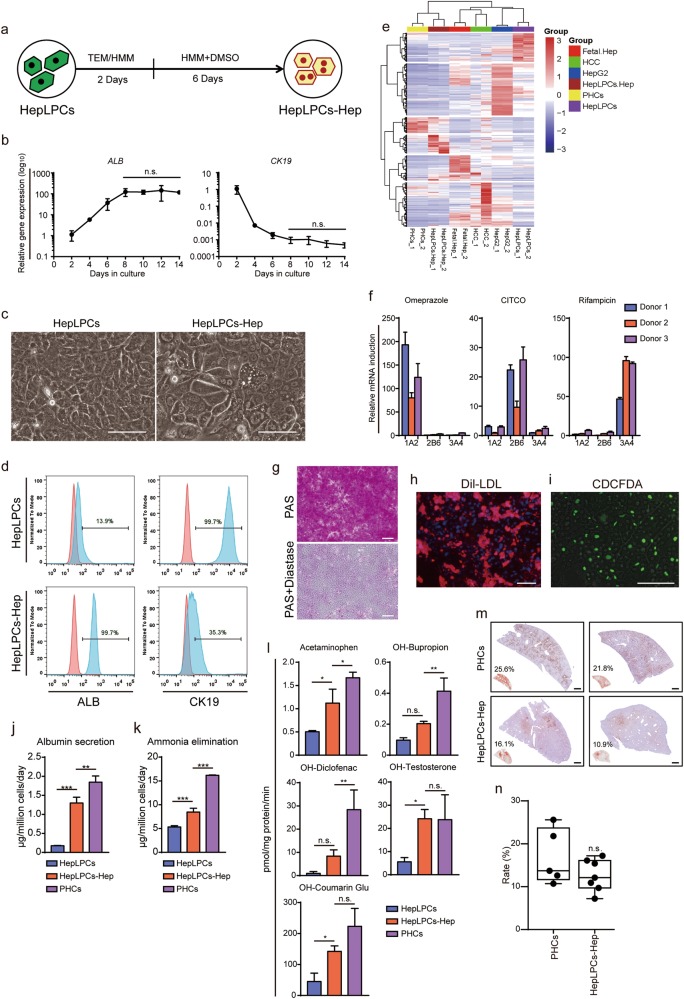
Efficient hepatic differentiation of HepLPCs in vitro. a Schematic of the hepatic-differentiation protocol. TEM/HMM, mixed by 1:1. b QPCR analyses for the expression ALB and CK19 during hepatic-differentiation of HepLPCs (passage 5) from day 2 to day 14. Error bars represent s.d.; n = 3 donors (one-way ANOVA with Tukey correction for multiple comparisons, n.s., non-significant). c Light microscopy images of HepLPCs versus HepLPCs-Hep. Scale bars, 50 μm. d Flow cytometric analysis showing the proportion of ALB and CK19 positive-cells in HepLPCs or HepLPCs-Hep from donor 4 passage 5. Blue, positive-cells; red, negative controls. (e) Euclidean hierarchical clustering of HepG2, HCC, HepLPCs, HepLPCs-Hep and PHCs using differentially expressed genes ( ≥2-fold changes and P < 0.001) in HepLPCs versus HepLPCs-Hep. f Induction of CYP450 expression in HepLPCs-Hep from three donors (passage 5) in response to stimulation with omeprazole, CITCO, and rifampicin for 72 h. 1A2, CYP1A2; 2B6, CYP2B6; 3A4, CYP3A4. Expression normalized to DMSO-treated controls. Error bars represent s.d.; n = 3 technical replicates. g PAS staining with or without diastase, h DiI-LDL uptake and i CDCFDA staining of HepLPCs-Hep. Scale bars, 100 µm. j Albumin production and k ammonia elimination during 24 h measured in supernatant, PHCs were freshly isolated. Error bars represent s.d.; n = 3 donors (one-way ANOVA with Tukey correction for multiple comparisons, **P < 0.01, ***P < 0.001). l CYP metabolic activities of HepLPCs, HepLPCs-Hep (passage 5) and PHCs (freshly isolated). The metabolic products of Acetaminophen, OH-Bupropion, OH-Diclofenac, OH-Testosterone and OH-Coumarin Glu determined by liquid chromatography-tandem mass spectrometry according to standard curves. Error bars represent s.d.; n = 3 donors (one-way ANOVA with Tukey correction for multiple comparisons, n.s., non-significant, *P < 0.05, **P < 0.01). m Representative immunohistochemical staining of hALB of human chimeric mouse liver tissues, PHCs were freshly isolated. Scale bars, 400 µm. n Quantification of the repopulation efficiency estimated by hALB-positive foci. No significant difference is noticed between PHCs and HepLPCs-Hep (passage 5). Error bars represent s.d.; n.s., non-significant

