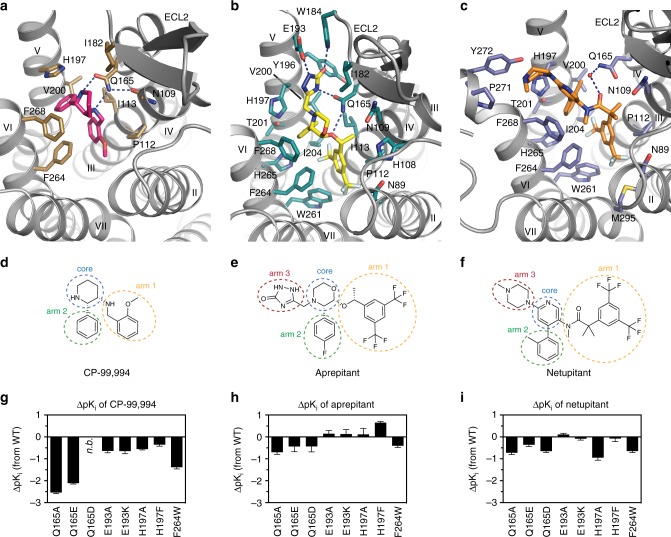
Fig. 2.
Drug-binding site of NK1R. a–c Detailed interactions of CP-99,994 (a), aprepitant (b) and netupitant (c) with the receptor, viewed from the extracellular side from a position above helix I. The receptor backbone is shown in grey ribbon representation. Ligand and receptor residues within 4 Å of the respective antagonist are shown as sticks and are coloured as in Fig. 1. The ordered water involved in netupitant binding is depicted as a red sphere (c). Hydrogen bonds are indicated by dashed blue lines. d–f Chemical structures of CP-99,994 (d), aprepitant (e) and netupitant (f) with structural topology highlighted by coloured, dashed circles (core coloured in blue, arm 1 in yellow, arm 2 in green, arm 3 in red, respectively). g–i Antagonist affinity profiles of selected mutants in comparison to wild-type NK1R. pKi values for each antagonist were derived from competition ligand-binding experiments (Supplementary Table 1). Bars represent differences in calculated affinity (pKi) values for each mutant relative to the wild-type receptor for CP-99,994 (g), aprepitant (h), and netupitant (i). Data are shown as mean values ± s.e.m. from three to five independent experiments performed in duplicates. n.b. no binding. Source Data

