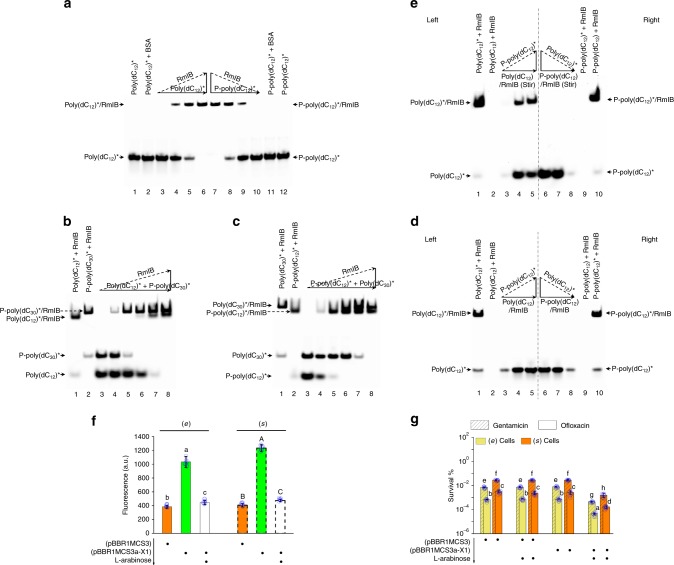
Fig. 2.
RmlB controls persistence in PAO1. a Formation of DNA/protein complex by RmlB binding poly(dC12)* or P-poly(dC12)*. In lanes 3–6, a constant concentration of poly(dC12)* and an increasing concentration of His-tagged RmlB were mixed together. In lanes 7–10, a constant concentration of P-poly(dC12)* and a decreasing concentration of His-tagged RmlB were mixed together. b Order of RmlB binding poly(dC12)* and P-poly(dC30)*. In lanes 3–8, a constant concentration of poly(dC12)*/P-poly(dC30)* mixture and an increasing concentration of His-tagged RmlB were mixed together. c Order of RmlB binding P-poly(dC12)* and poly(dC30)*. In lanes 3–8, a constant concentration of P-poly(dC12)*/poly(dC30)* mixture and an increasing concentration of His-tagged RmlB were mixed together. d, e Substitutability of ssDNA in poly(dC12)/RmlB and P-poly(dC12)/RmlB. In lanes 3–5, a constant concentration of poly(dC12)/RmlB and an increasing concentration of P-poly(dC12)* were mixed together with (e) or without (d) vortex. In lanes 6–8, a constant concentration of P-poly(dC12)/RmlB and a decreasing concentration of poly(dC12)* were mixed with (e) or without (d) vortex. f Red fluorescence of cells harboring pBBR1MCS3a-X1 with or without l-arabinose induction. The RmlB fused with mCherry was expressed from a native promoter of rmlB in pBBR1MCS3a-X1. It caused a 2.9-fold increase in fluorescence as compared to cells harboring pBBR1MCS3. Red fluorescence was decreased 2.47-fold upon expression of rmlBasRNA from pBBR1MCS3a-X1 with 0.2% l-arabinose induction. The basal level of fluorescence with the empty vector (pBBR1MCS3) should come from the metabolites of bacteria. a.u. arbitrary units. g Persistence in cells harboring pBBR1MCS3a-X1 with or without l-arabinose induction. Expressing rmlBasRNA with 0.2% l-arabinose induction caused a nearly 24-fold decrease in persistence of the (e) or (s) cells. All experiments were performed in biological triplicates. Error bars represent standard deviations. Dot plots overlaid on bar graphs represent individual data points. Black spot, treatment step or object; arrow, treatment order

