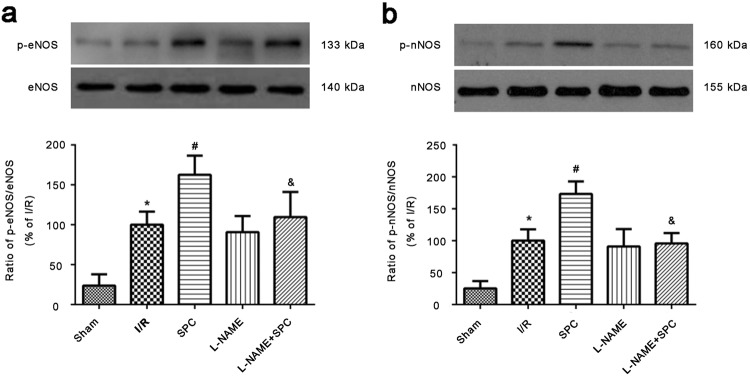
Fig. 9.
SPC-induced increases in the phosphorylation of eNOS and nNOS. These effects of SPC were abolished by the NOS inhibitor l-NAME in the in vivo model. a Western blot bands of eNOS and p-eNOS and the ratio of p-eNOS/total eNOS. b Western blot bands of nNOS and p-nNOS and the ratio of p-nNOS/total nNOS. The data are presented as the means ± SD. *P < 0.05 vs. Sham group; #P < 0.05 vs. I/R group; &P < 0.05 vs. SPC group (n = 5 hearts/group)

