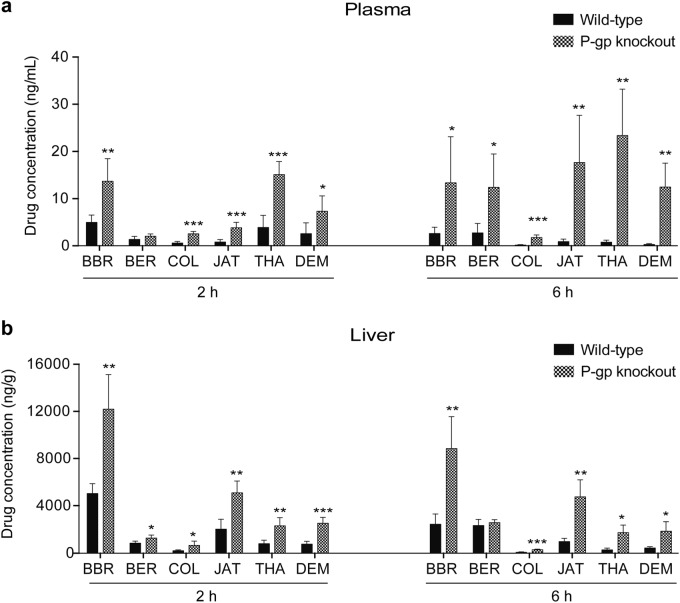
Fig. 1.
The plasma and tissue concentrations of BBR and its metabolites in WT and P-gp-KO mice. Concentrations of BBR and its metabolites in the plasma (a) and liver (b) were detected at 2 and 6 h after the oral administration of 150 mg/kg BBR (n = 5/group/time point). Data are mean ± SD. Significance was analyzed by non-paired t test. P values <0.05 were considered statistically significant (*P < 0.05, **P < 0.01, ***P < 0.001)

