Fig. 2.
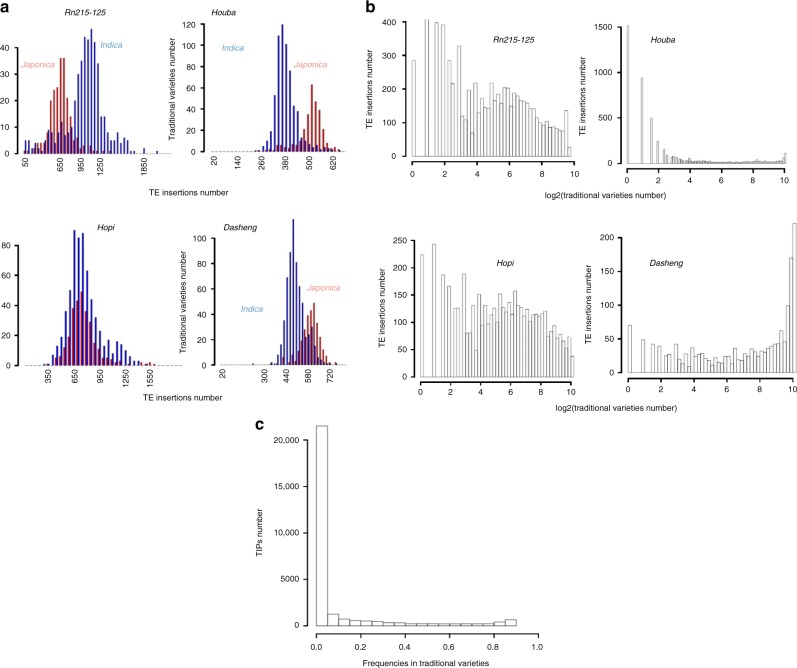
History of TE families. a Distribution of the number of TE insertions in traditional varieties. x axis represents the number of TE insertions for each TE family. Indica and Japonica varieties are shown in blue and red, respectively. b Distribution of traditional varieties by TE insertion. The x axis represents the number of rice traditional varieties in log2 scale and y axis the number of TE insertions. For all the TE families, the peak on the left corresponds to TE insertions present at very low frequencies in rice varieties, which suggests recent insertions. c Distribution of frequencies of TIPs in traditional varieties. x axis shows the frequency of TE insertion in traditional varieties and y axis shows the frequencies for all TE insertion in all 32 families. Most TIPs are present with low frequencies (<0.01), i.e., TE insertions are only in one or two rice varieties

