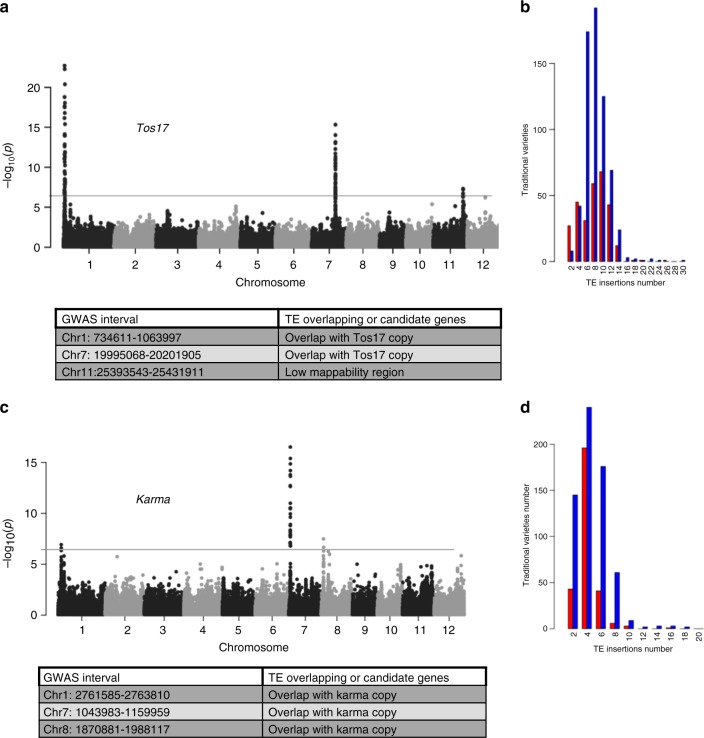
Fig. 4.
GWAS analysis of Tos17 and Karma TE families. GWAS analysis for Tos17 (a) and Karma (b) TE families. Manhattan plot represents the log10 p value for each association between the single-nucleotide polymorhisms and the TE insertion (see Methods). TE insertion-SNP association p value >6 are significative. c, d The TE insertion distribution in rice traditional varieties (Fig. 3) reflects a polymorphism in TE copy number along rice varieties, considered a quantitative phenotype

