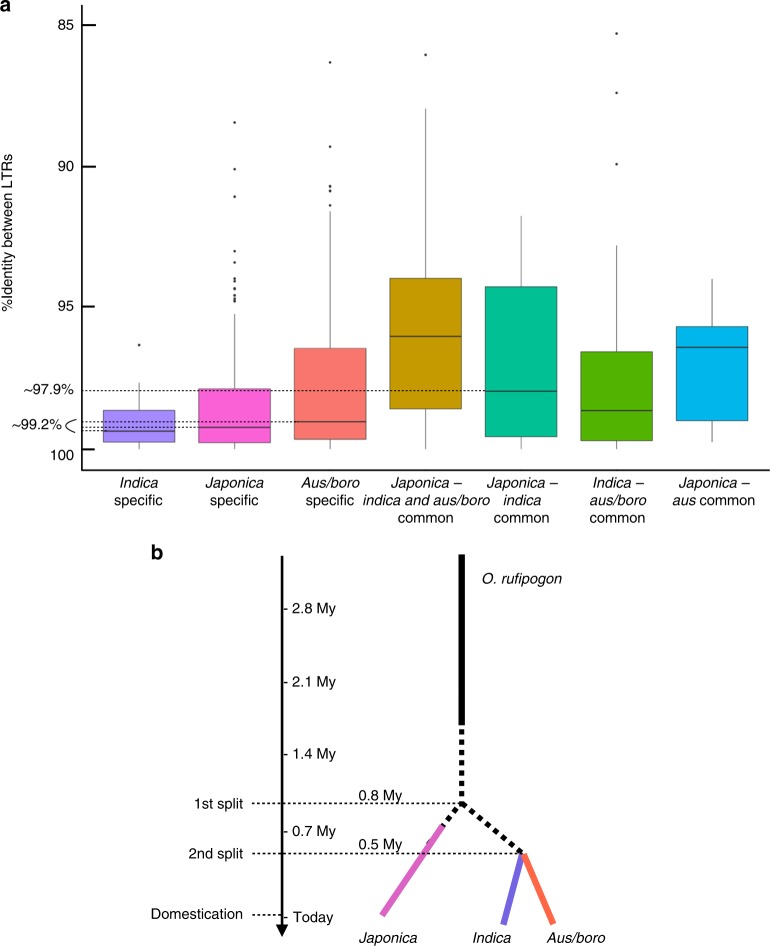
Fig. 6.
Origin of rice domestication. a The box plots represent the distribution of percent identity between LTRs of retrotransposons for insertions that are Indica-specific (N = 91), Japonica-specific (N = 266), Aus/Boro-specific (N = 216), common to the three groups (N = 138), common to Indica/Japonica (N = 32), common to Indica/Aus (N = 30), and common to Japonica/Aus (N = 12), respectively. The three horizontal dashed lines correspond to the mode of distribution of Indica-, Japonica-, and Aus-specific insertions. b Representation of the history of the three domestications of Asian rice

