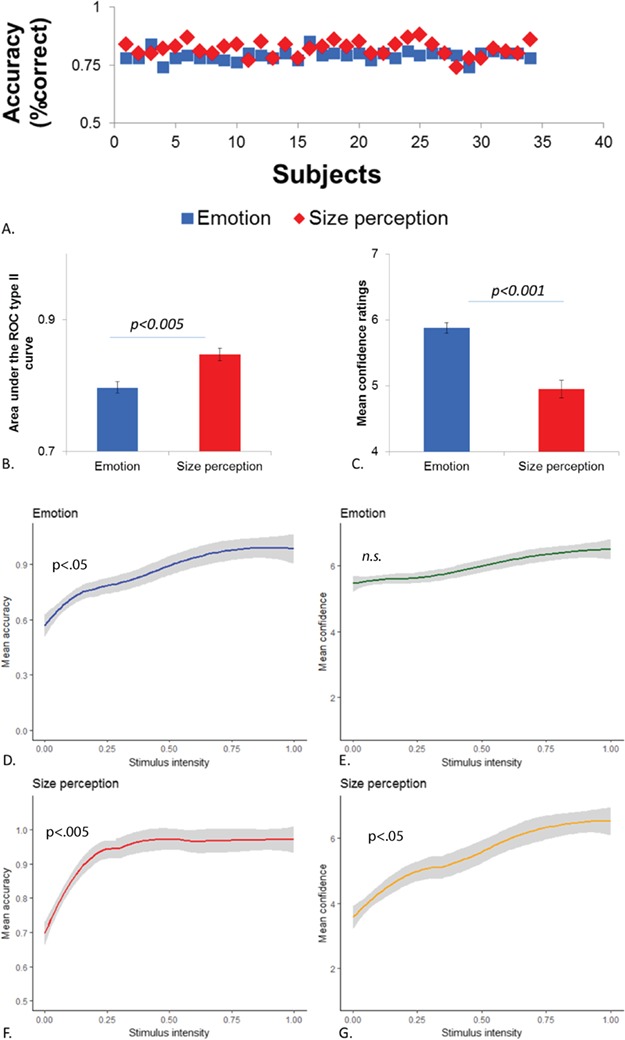
Fig. 2.

Overview of behavioral results. Accuracy scores (percent correct) for all subjects (A), mean area under the ROC Type II curve (B) and mean confidence ratings (C) for ER (blue) and S (red) tasks. Errors bars represent standard error. Relationship of the stimulus intensity level with (D, F) mean accuracy and (E, G) mean confidence ratings, for each task (ER, left panels; S, right panels) and accompanying 95% confidence bands in the shaded area. Accuracy progressively increased with increasing stimulus intensity levels for both tasks. Mean confidence tracked well stimulus intensity levels for the S task, but remained relatively high and flat throughout the different stimulus levels for ER.
