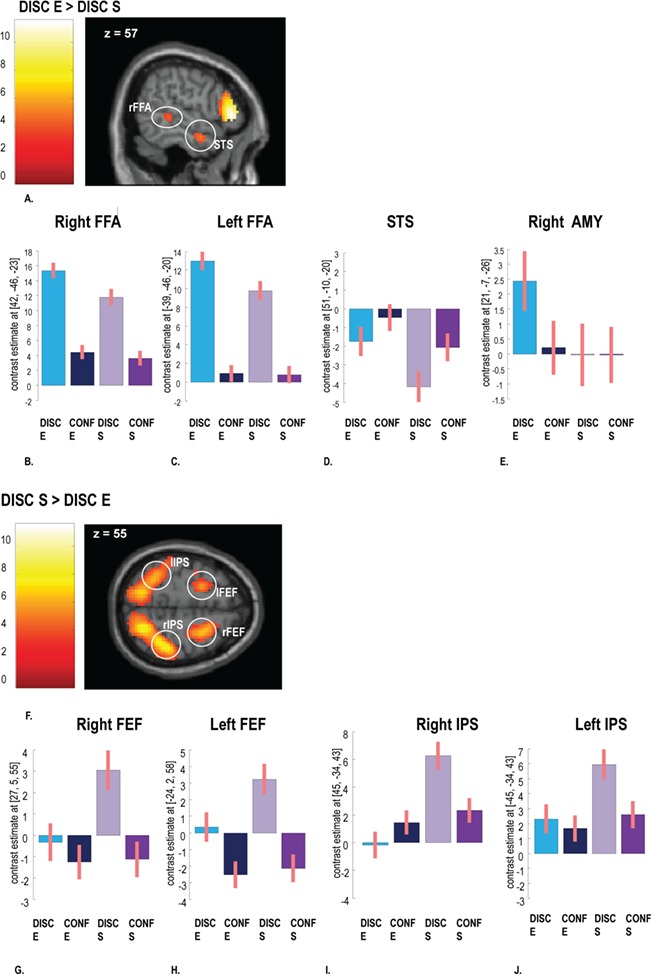
Fig. 3.

fMRI results showing activations associated with stimulus discrimination. (A) Main effect of the ER task (DISC E > DISC S). Mean beta coefficients illustrating the differential effects of experimental conditions are extracted from clusters in the (B) right FFA, (C) left FFA, (D) right STS and (E) right AMY. (F) Main effect of the S task (DISC S > DISC E). Mean beta coefficients across experimental conditions from (G) right FEF, (H) left FEF, (I) right IPS and (J) left IPS. Activations maps are corrected for multiple comparisons pFWE < 0.05 at the cluster level. Errors bars represent standard error.
