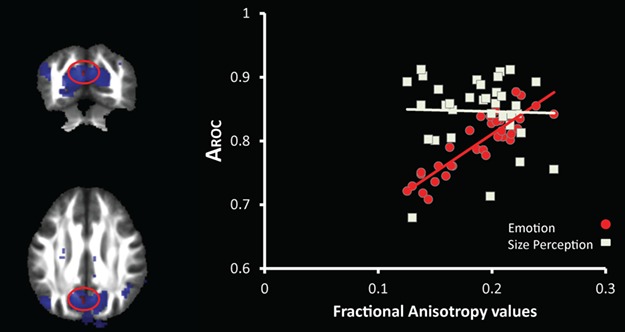
Fig. 6.

DTI results. Statistical maps of the whole-brain correlation between white matter structure (FA values) and metacognition for ER (AROC values), illustrating the correspondence with functional MRI results. (A) A significant correlation between FA and AROC values for ER was observed in overlapping voxels (in red, cluster peak at [−3, −67, 28], P < 0.05 corrected for multiple comparisons after small volume correction based on the functional mask; circled by a red ellipse on the coronal and axial views). Functional cluster (in blue) activated in the contrast CONF E > CONF S, thresholded at P < 0.05, uncorrected for illustration purpose. (B) Scatter plot of FA values at [−3, −67, 28] against AROC values for ER (in red) and S (in white) tasks.
