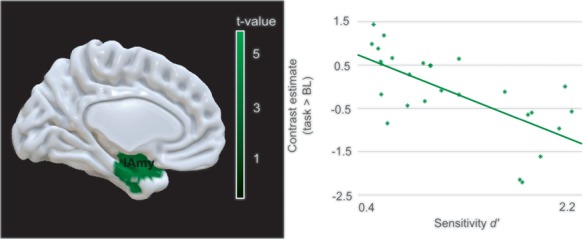
Fig. 4.

Task-related brain activity modulated by participants’ sensitivity d′. Brain activity map depicting brain regions whose neural activation during task compared to baseline negatively correlated with sensitivity d′. The scatterplot visualizes the relationship of sensitivity d′ with the contrast estimates of the respective peak region. The cluster forming threshold was set to P < 0.005 (uncorrected), the cluster threshold to P < 0.05 (FWE) and cluster size k > 260 voxels. [lAmy, left amygdala]
