. 2018 Dec 28;27(6):489–507. doi: 10.5607/en.2018.27.6.489

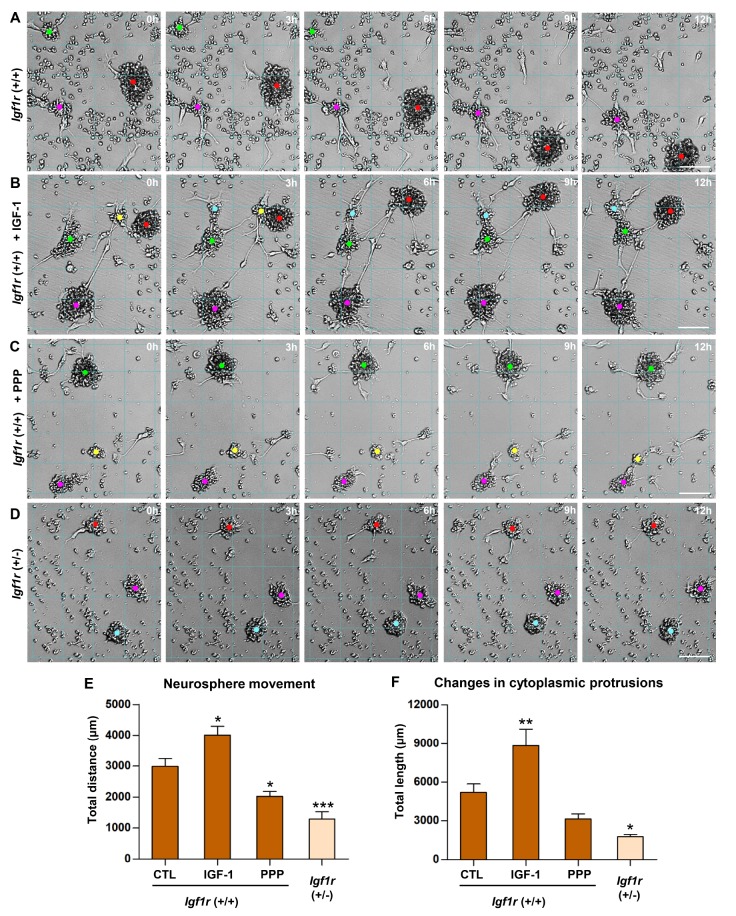
Fig. 9. Regulation of NSC motility by IGF-1/IGF-R signaling. (A~D) Representative still images of cultured neurospheres obtained using a live cell imaging apparatus. Images were taken at the designated time points. 0 h indicates a start of image tracking for the next 12 h, not the absolute start of the culture. Neurospheres were obtained from NSCs wild-type (+/+) (A~C) or heterozygous (+/−) (D) for Igf1r gene. +/+ neurospheres were treated with control (CTL) PBS (A), IGF-1 (50 ng/ml) (B), or an IGF-1R inhibitor picropodophyllin (PPP, 100 µM) (C). (+/−) neurospheres were treated with only CTL PBS (D). Grid lines are drawn to facilitate tracking positions of neurospheres. Colored dots indicate the marks of neurosphere centers that are traced to quantify distances of neurosphere movements. Neurospheres marked with dots of the same color in the images at different time points are the identical ones. Scale bars indicate 100 µm. (E, F) Quantification graphs of the moving distance (E) of the tracked neurospheres and the length of changes in cytoplasmic protrusions (F) growing from the tracked neurospheres. Total cumulative distance or length traced for the entire culture duration was plotted. N=15 neurospheres tracked from three independent cultures. *, **, and *** represent p<0.05, p<0.01, and p<0.001 compared to +/+ CTL condition by one-way ANOVA followed by Tukey's post hoc analysis.

Fig. 9