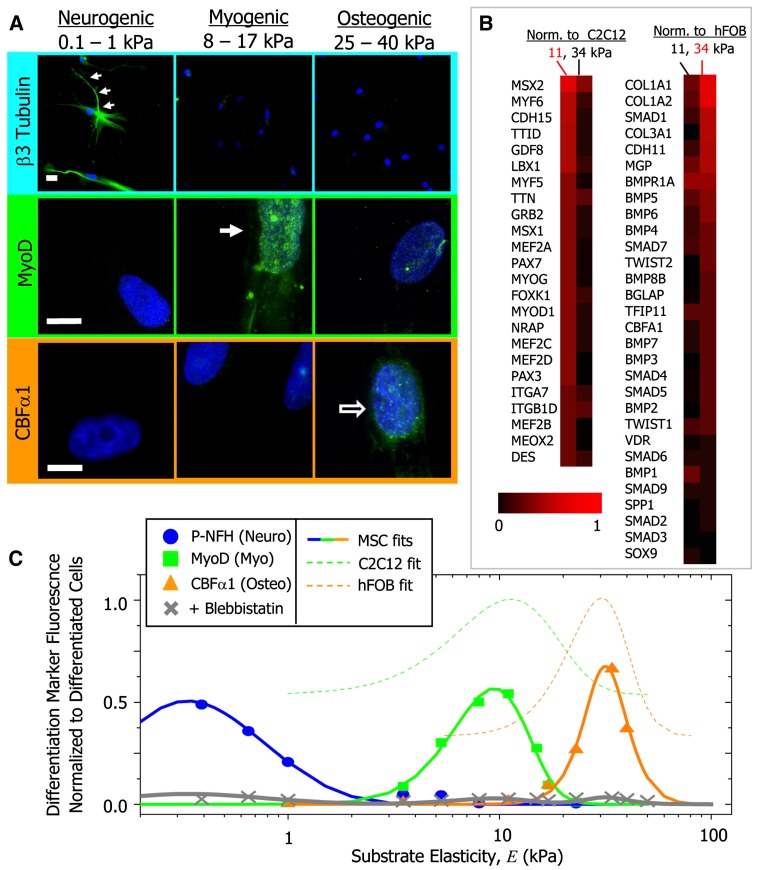
Figure 4.
Protein and transcript profiles are elasticity dependent under identical media conditions (A) The neuronal cytoskeletal marker b3 tubulin is expressed in branches (arrows) of initially naive MSCs (>75%) and only on the soft, neurogenic matrices. The muscle transcription factor MyoD1 is upregulated and nuclear localized (arrow) only in MSCs on myogenic matrices. The osteoblast transcription factor CBFa1 (arrow) is likewise expressed only on stiff, osteogenic gels. Scale bar is 5 mm; (B) Microarray profiles of MSCs cultured on 11 or 34 kPa matrices, with expression normalized first to actin and then to expression of committed C2C12 myoblasts and hFOB osteoblasts; (C) Fluorescent intensity of differentiation markers versus substrate elasticity reveals maximal lineage specification at the E typical of each tissue type. Average intensity is normalized to peak expression of control cells (C2C12 or hFOB). Adapted with permission from [85]. Copyright 2006 Elsevier.

