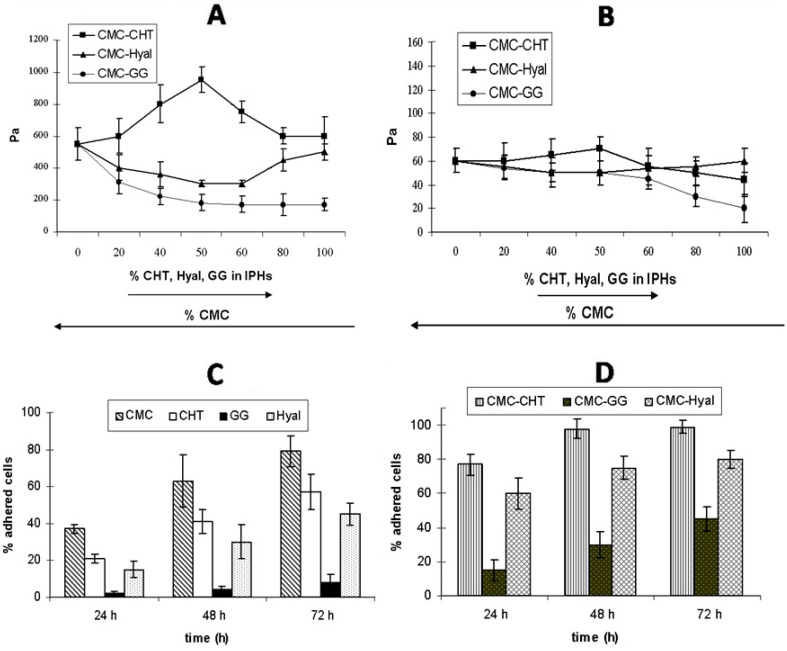
Figure 5.
G' (A) and G" (B) values for mixed hydrogels, plotted as a function of the relative percentage of each native hydrogel in the IPHs; (C) and (D) show the percentage of fibroblasts vs. time (h) for each native hydrogel (C) and mixed hydrogel (D) [17].

