
Fig. 3.
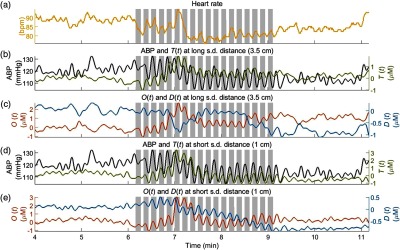
Representative time series of the data collected on subject no. 1. (a) Heart rate, (b) ABP and at a source–detector (s.d.) distance of 3.5 cm, (c) and at 3.5 cm, (d) ABP and at 1 cm, and (e) and at 1 cm. The shaded areas indicate the times of thigh cuffs inflation.