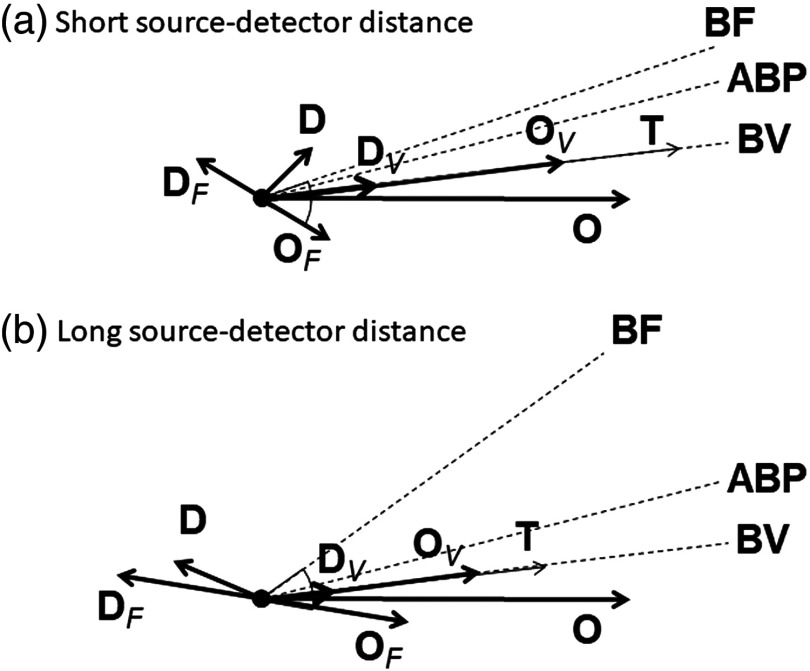
Fig. 8.
Phasor diagrams representative of the oscillatory hemodynamics induced by ABP oscillations as measured with NIRS on the forehead of human subjects at (a) short and (b) long source–detector distance. Dashed lines indicate the phase of BF, ABP, and BV oscillations. Subscripts and indicate volume and flow contributions, respectively, to oxyhemoglobin () and deoxyhemoglobin () concentration oscillations. Key phasor relationships are: , , , and .

