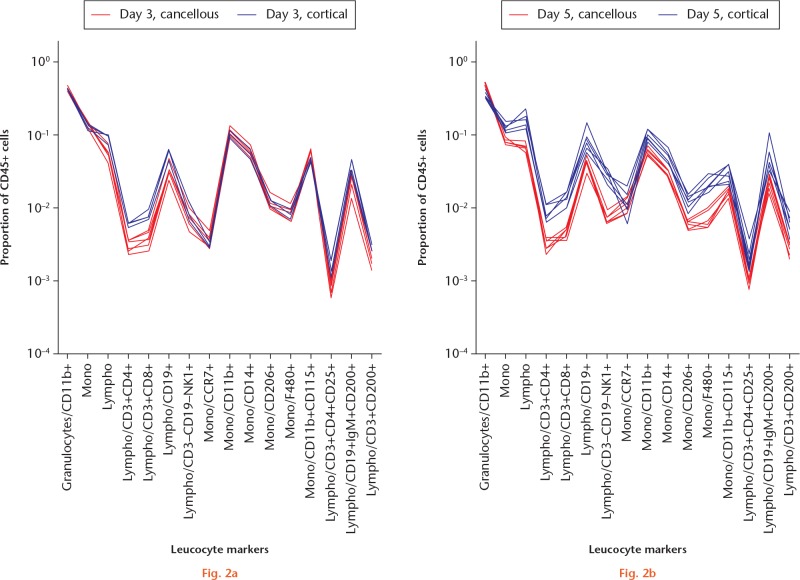
Graphs showing comparison of a) the traumatized proximal tibia (cancellous) and b) the femoral cortical defect (cortical) models for different timepoints. Regenerating tissue was analyzed with flow cytometry. Day 3: each red line indicates a mouse with a cancellous injury (n = 6/6) and each blue line represents one with a cortical defect (n = 3/6). At this timepoint, red and blue lines tend to overlap, indicating a generally similar pattern. Major cell populations were gated from singlet/scatter/live/CD45+ cells and subpopulations gated as shown along the x-axis. Each subpopulation is shown as a fraction of the total leucocyte count (singlet/scatter/live/CD45+ cells) on a logarithmic scale.

An official website of the United States government
Here's how you know
Official websites use .gov
A
.gov website belongs to an official
government organization in the United States.
Secure .gov websites use HTTPS
A lock (
) or https:// means you've safely
connected to the .gov website. Share sensitive
information only on official, secure websites.
