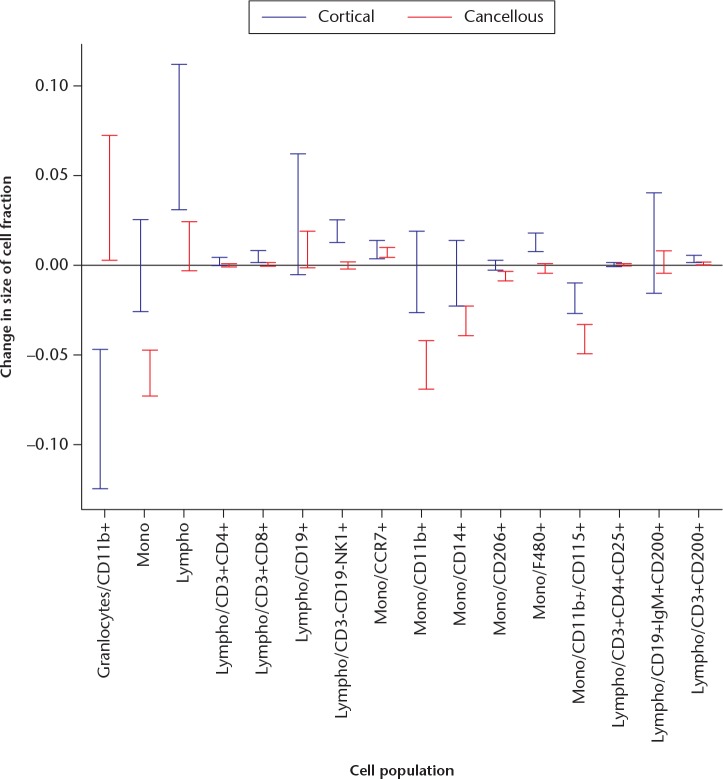
Fig. 5.
A graph showing the change in the size of the cell fraction for each subpopulation from day 3 to day 5 in the cancellous and cortical models, with 95% confidence intervals. For example, granulocytes/CD11b+ (far left) decreased by 5% to 15% in the cortical model (blue), but increased by 0.5% to 7% in the cancellous model (red).

