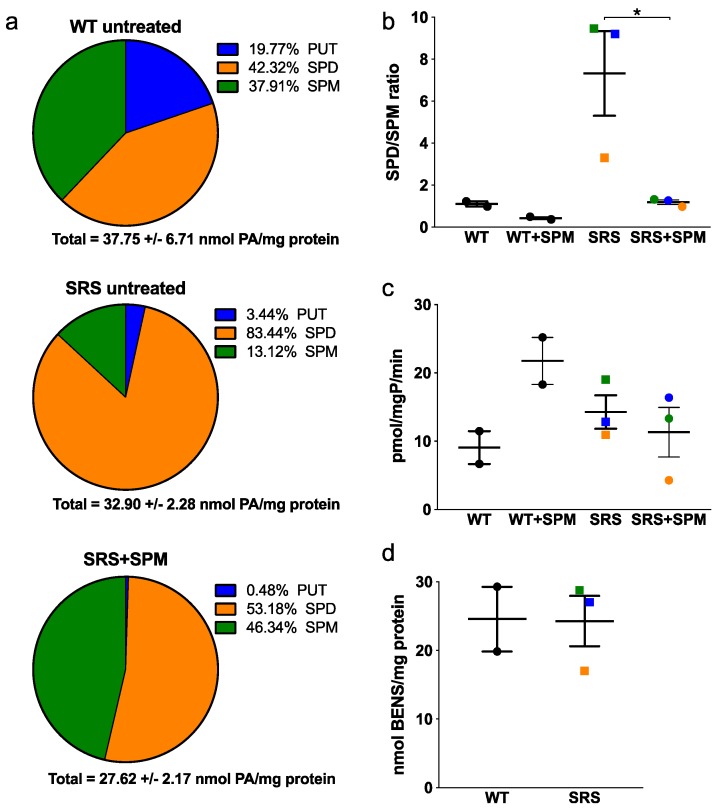
Figure 6.
(a) Average polyamine levels of SRS lymphoblast lines before (middle) and after (bottom) 5 μM SPM treatment for 24 h, compared with untreated WT lymphoblast lines (top). (b) SPD/SPM ratios and (c) SSAT activity before and after SPM supplementation. (d) Intracellular accumulation of bis(ethyl)norspermine (BENSpm) following 10 μM treatment for 24 h. Color designations in (b–d) are orange for SRS1, blue for SRS2, and green for SRS3. All error bars indicate SEM (n ≥ 2, in triplicate; * p < 0.05).

