Figure 1.
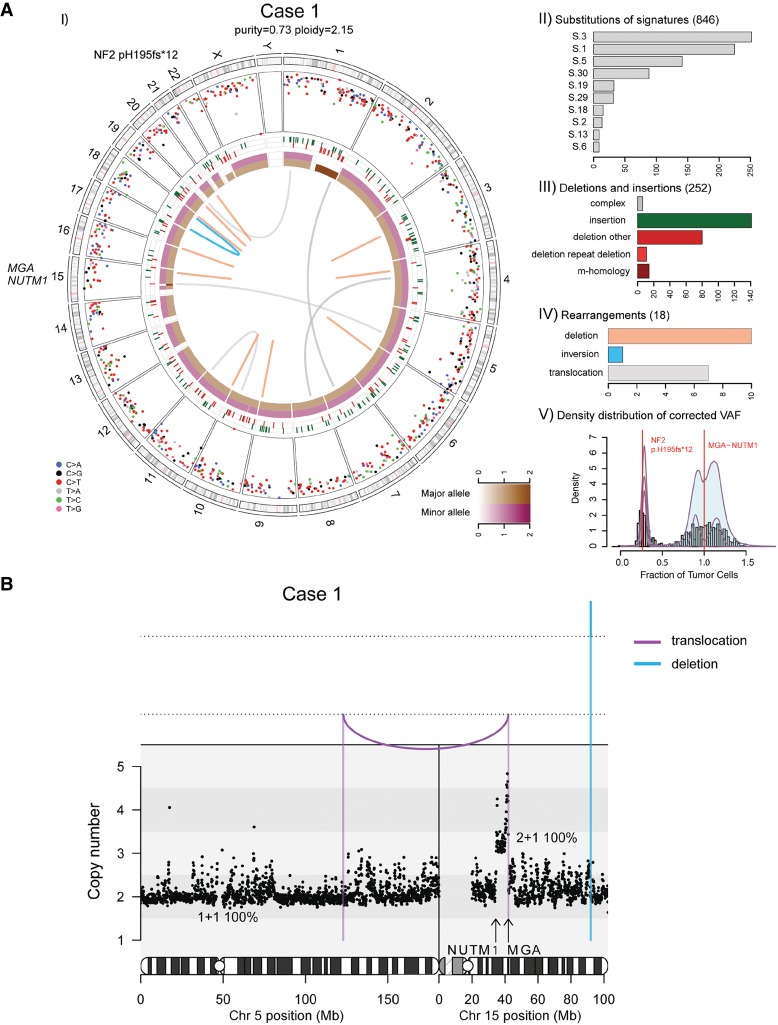
(A) Whole-genome analysis identifies a novel MGA–NUTM1 fusion in Case 1. (I) Circos plot summarizing the whole-genome sequencing (WGS) data. The two innermost tracks depict the integer copy-number changes for the major (brown) and minor (dark pink) allele. The outermost track shows the intermutation distance for substitutions each plotted according to the type of nucleotide change. The middle track shows the genomic positions of the small insertions (green) and deletions (red) along the genome. Rearrangements are plotted as arcs inside the Circos plot. Genes affected by potential oncogenic changes are annotated. (II) Mutation signature analysis of the substitutions using Mutational Patterns. Only the signatures with the 10 highest exposures are shown. (III) Summary of the indel data also showing the contribution of repeat- or microhomology-mediated mechanisms among deletions. (IV) Summary of rearrangement data. (V) Statistical analysis of the corrected variant allele frequency of substitution by Bayesian Dirichlet process–based clustering. Empiric histogram of substitutions is shown in gray together with the density from clustering in pale green and the fitted distribution in dark pink. Potential oncogenic alterations are annotated. (B) Integrated copy-number/rearrangement plots showing the WGS-based absolute copy number (y-axis) across the indicated genomic region (x-axis). Rearrangements are depicted as lines perpendicular to the x-axis.

