Figure 1.
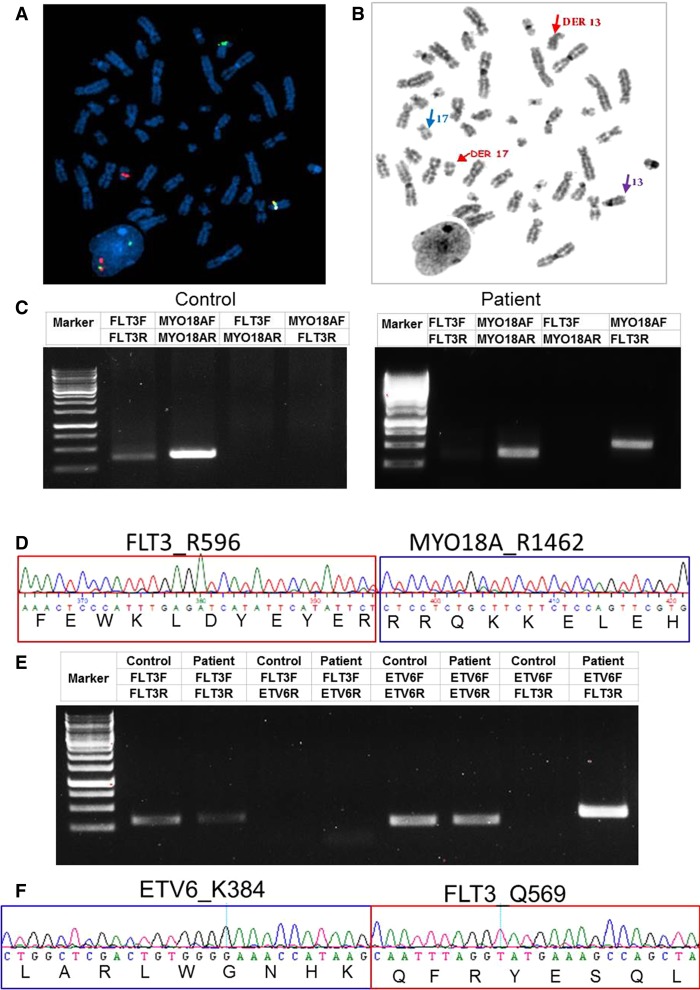
Identification of FLT3 fusions. (A) FISH analysis on interphase and available metaphase cells was performed with an Agilent FLT3 (13q12.2) break-apart probe. The FISH image shows that the distal FLT3 signal (red; including at least exons 1–9, based on probe build) hybridized to Chromosome 17 near the centromere; the proximal FLT3 signal (green; including at least exons 20–24, based on probe build) was retained on Chromosome 13, near the centromere, band 13q12.2. (B) The parallel DAPI-banded image, with the der(13), der(17), and normal homologs identified. Blue arrow: normal Chromosome 17; purple arrow: normal Chromosome 13. (C) PCR validation of the MYO18A-FLT3 fusion transcript. A multiplex RT-PCR was designed to detect MYO18A-FLT3 product with mRNA derived from Case 1's peripheral blood mononuclear cells (PBMCs). A leukemia patient without fusions was used as control. (D) Sequencing of the junction PCR product revealed an in-frame fusion between MYO18AR1462 and FLT3R596. (E) Identification of the ETV6-FLT3 fusion transcript. A multiplex RT-PCR was designed to detect ETV6-FLT3 product with mRNA derived from Case 2's PBMC. A leukemia patient without fusions was used as a control. (F) Sequencing of the junction RT-PCR product revealed an in-frame fusion between ETV6 K384 and FLT3 Q569.

