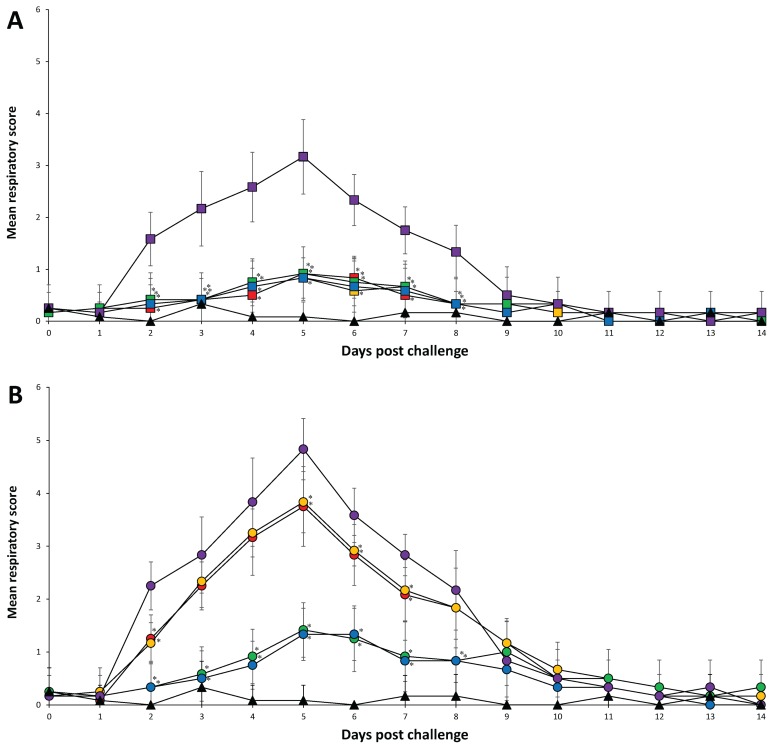
Figure 2.
Mean respiratory score. A — PRRSV-1 challenged groups from the Vac1A/Ch1 (
 ), Vac1B/Ch1 (
 ), Vac2A/Ch1 (
 ), Vac2B/Ch1 (
 ), UnVac/Ch1 (
 ), and UnVac/UnCh (▲). B — PRRSV-2 challenged groups from the Vac1A/Ch2 (
 ), Vac1B/Ch2 (
 ), Vac2A/Ch2 (
 ), Vac2B/Ch2 (
 ), UnVac/Ch2 (
 ), and UnVac/UnCh (▲). Variation is expressed as the standard deviation. Significant difference between vaccinated challenged and unvaccinated challenged groups within the same PRRSV type challenge is indicated as P < 0.05*.

