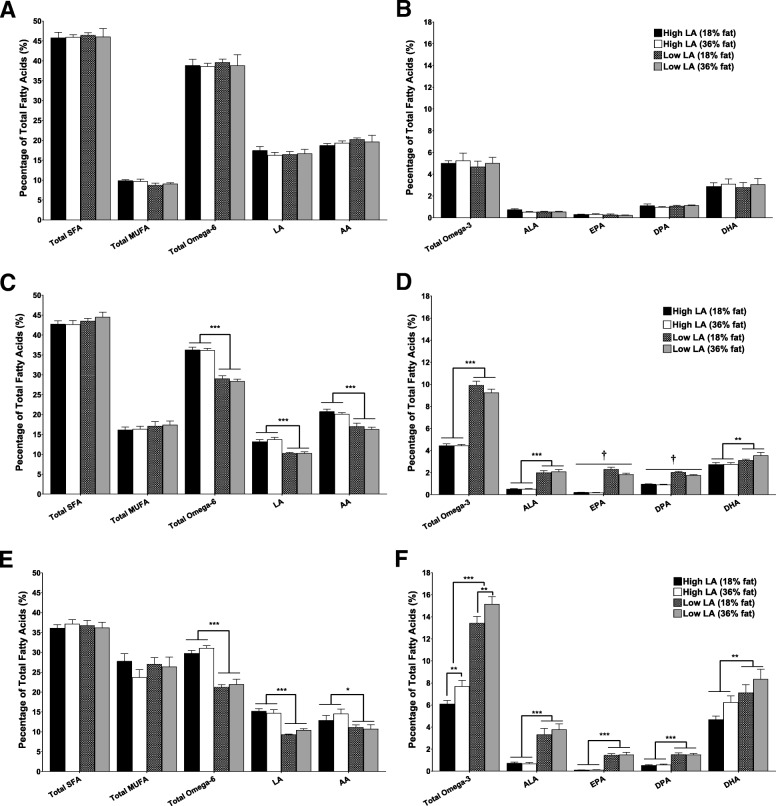
Fig. 2.
Maternal whole blood fatty acids profile at (a/b) baseline (c/d) after 4 weeks on experimental diet and (e/f) at day 20 of gestation. Values are means ± SEM and n = 5–7 per group. The effects of dietary fatty acid ratio and dietary fat content were determined using a two-way ANOVA (*P < 0.05, **P < 0.01, ***P < 0.001). † indicates a significant interaction between dietary fat content and LA:ALA ratio (P < 0.05)

