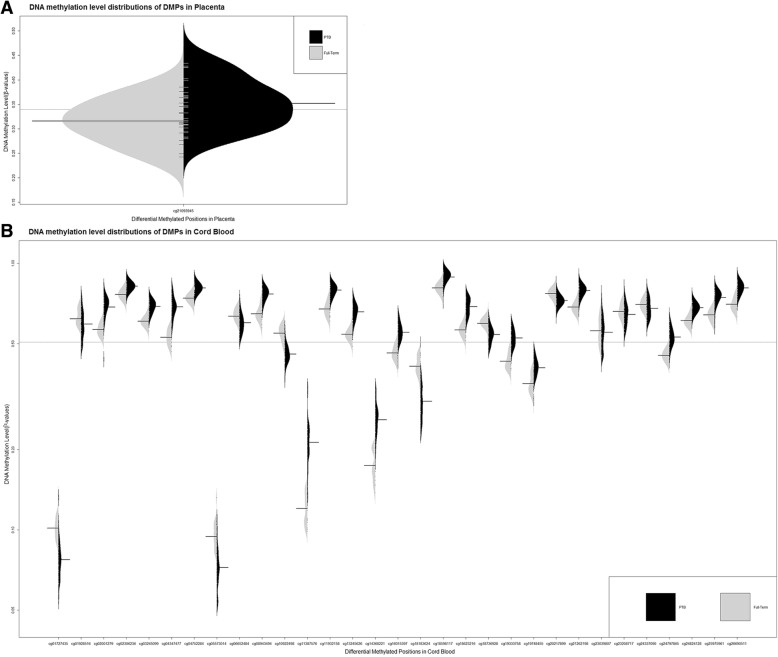
Fig. 2.
DNA methylation level distribution of significant DMPs in placenta and cord blood. a DNA methylation level distribution of significant DMPs in placenta. b DNA methylation level distribution of all significant DMPs in cord blood. The black horizontal lines in the beanplots represent the mean β-values of DMPs in the case and control groups. The dashed horizontal lines represent the mean β-values of all DMPs in each graph

