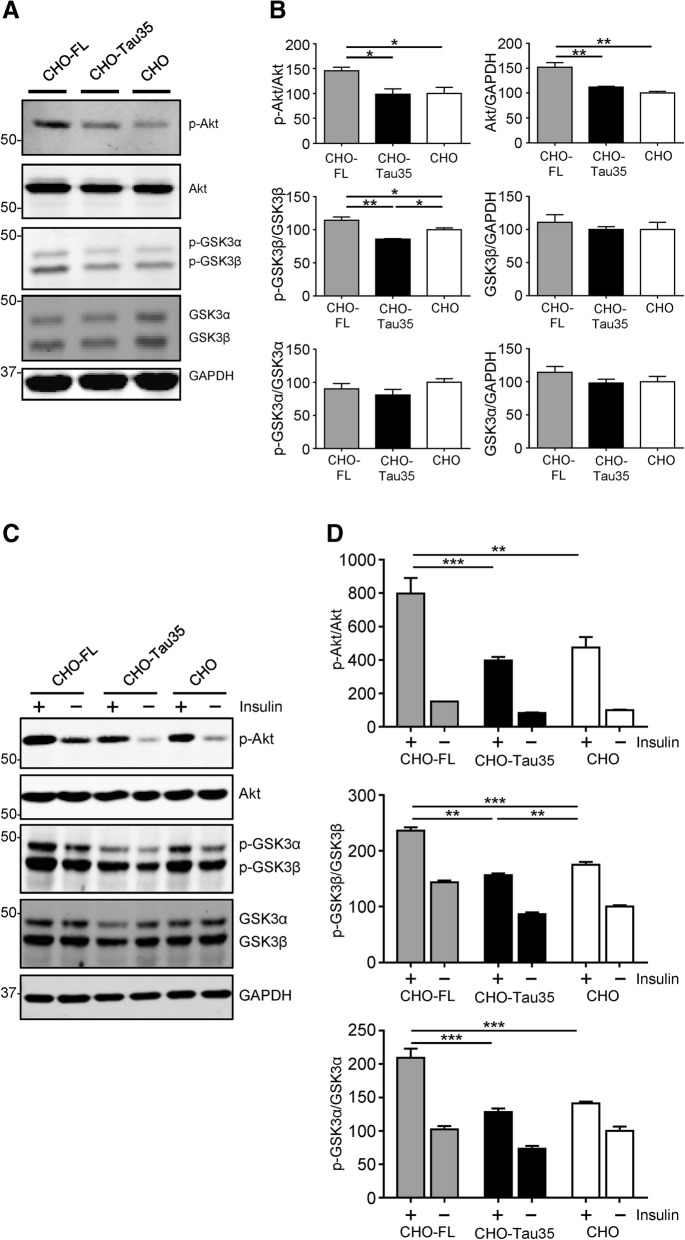
Fig. 4.
Differing effects of FL-tau and Tau35 on Akt/GSK3 signaling. a Western blots of CHO-FL, CHO-Tau35 and untransfected CHO cell lysates probed with antibodies against phosphorylated and total Akt, phosphorylated and total GSK3α/β, and glyceraldehyde 3-phosphate dehydrogenase (GAPDH). Molecular weight markers (kDa) are shown on the left. b Graphs show the percentage of phosphorylated/total Akt and phosphorylated/total GSK3α/β, relative to untransfected CHO cells (100%). Values represent mean ± S.E.M., n = 4, one-way ANOVA, *P < 0.05, **P < 0.01. c Western blots of lysates of CHO-FL, CHO-Tau35 and untransfected CHO cell lysates treated with (+) or without (−) 100 nM insulin for 30 min. Blots were probed with antibodies against phosphorylated and total Akt, phosphorylated and total GSK3α/β, and GAPDH. Molecular weight markers (kDa) are shown on the left. d Graphs show phosphorylated/total Akt, phosphorylated/total GSK3β, and phosphorylated/total GSK3α. Data are displayed as percentage change compared to the untreated CHO cells (100%). Values represent mean ± S.E.M., n = 6, two-way ANOVA, **P < 0.01, ***P < 0.001

